

HOT TOPICS LIST
- MACD
- Fibonacci
- RSI
- Gann
- ADXR
- Stochastics
- Volume
- Triangles
- Futures
- Cycles
- Volatility
- ZIGZAG
- MESA
- Retracement
- Aroon
INDICATORS LIST
LIST OF TOPICS
PRINT THIS ARTICLE
by Donald W. Pendergast, Jr.
Now rebounding from a steady, multimonth decline of 28%, shares of Schlumberger Ltd. must deal with a heavy overhead supply zone.
Position: N/A
Donald W. Pendergast, Jr.
Freelance financial markets writer and online publisher of the Trendzetterz.com S&P 500 Weekly Forecast service.
PRINT THIS ARTICLE
VOLUME
SLB: Heavy Supply Zone Overhead
10/22/14 05:22:09 PMby Donald W. Pendergast, Jr.
Now rebounding from a steady, multimonth decline of 28%, shares of Schlumberger Ltd. must deal with a heavy overhead supply zone.
Position: N/A
| The oil services industry group stocks have had a rough summer/fall season in 2014; with the world now awash in crude oil and natural gas at a time of slowing global growth, the stocks of such companies have reflected this by selling off hard. With a relief rally now underway in many stocks in the group, it pays to know in advance where the strongest resistance zones are (areas of supply that frequently turn back rallies) so as to better time the trading opportunities presented by the market. Here's a look now at a powerful volume-based resistance zone that has been identified on Schlumberger Ltd.'s (SLB) 130 minute chart (Figure 1). |
|
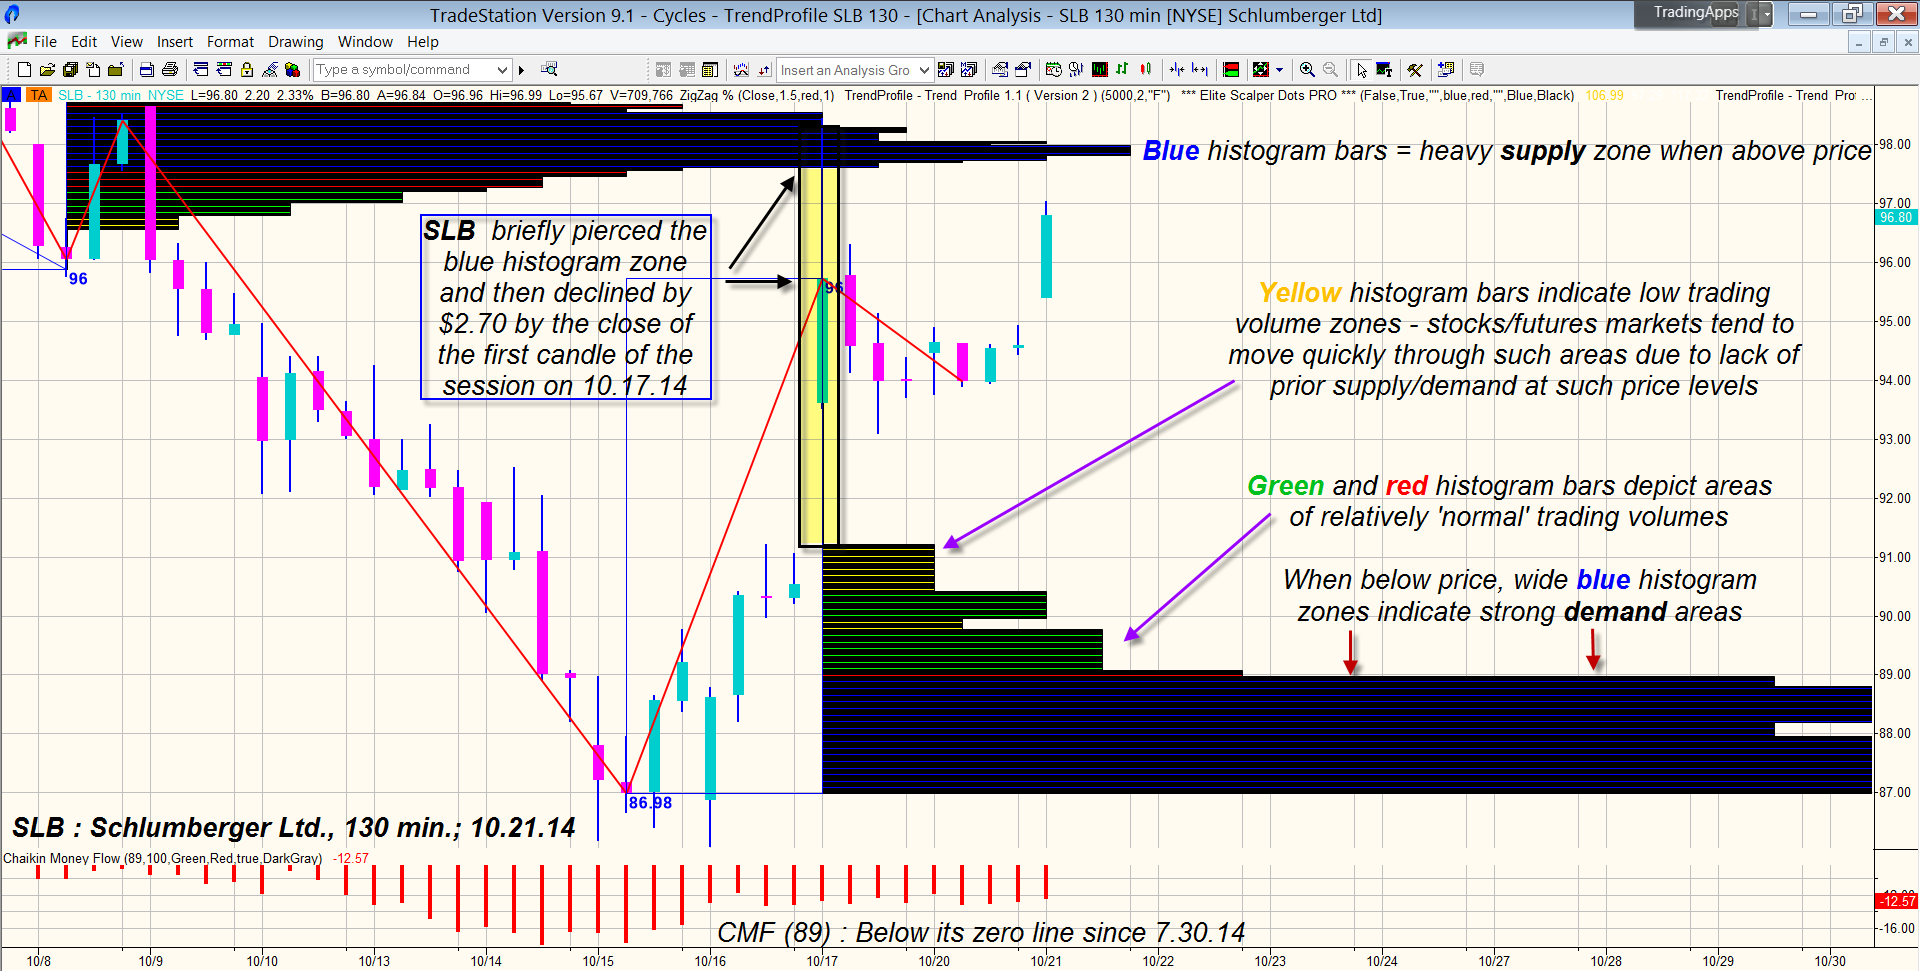
| Figure 1. A 130-minute Chart. Schlumberger Ltd. (SLB) rises into a heavy supply zone, reaches 98.44 and then pulls back by more than 2.7% during the first 130 minutes of trading on October 17, 2014, closing at 95.74. |
| Graphic provided by: TradeStation. |
| Graphic provided by: Trend Profile by Trading-Algo.com. |
| |
| This 130-minute chart has the Trend Profile indicator and an 89-period Chaikin money flow histogram (CMF)(89) overlaid on it; SLB has made steady upward progress since bottoming on October 16, 2014 at 86.00 and managed to make it up to 98.44 early in last Friday's session (October 17, 2014) but suddenly stalled out, with the first candle of the session closing at 95.74. Why is this and why did it happen? Here's an explanation: 1. Notice the long blue horizontal Trend Profile histogram zone just above the intraday high of 98.44; this is an area of extremely heavy prior trading volume which occurred during the swing lower from 103.69 to 96.00 (September 26, 2014 to October 8, 2014) and can now be thought of as a price magnet and/or heavy resistance zone. That's because the blue histogram zones identify (ahead of time - the Trend Profile is a leading rather than lagging indicator) areas of heavy supply (when above the current price of the stock/ETF or futures market being analyzed) and demand (when the blue histogram zones are beneath prices). The wider and longer the blue histogram, the more pronounced the dynamics of supply/demand (resistance/support) are likely to be. 2. Note also that the 89-period Chaikin money flow (CMF)(89) histogram (bottom of the chart) is still below its zero line — and has been since July 30, 2014. These two unique interpretations of trading volume suggested — in advance of SLB's run up to 98.44 — that any move up into the blue histogram zone was going to meet with a reaction of some degree and that existing longs would do well to protect any open gains. Look at the long upper shadow on the candle — after piercing into the blue Trend Profile zone, prices quickly retraced by $2.70 per share, leaving a long upper candle shadow. Have you ever wondered why so many otherwise strong trend following/swing moves all of a sudden lose momentum, almost as if they've hit a brick wall? The answer is that the trend was terminated or forced to pause because it hit one of these heavy areas of supply or demand created at an earlier time (supply/demand zones derived from more recent market swings are typically thought to have more predictive power, but multimonth/multiyear supply/demand zones identified by the blue Trend Profile histogram can also serve as potent leading indicators to be aware of.) |
|
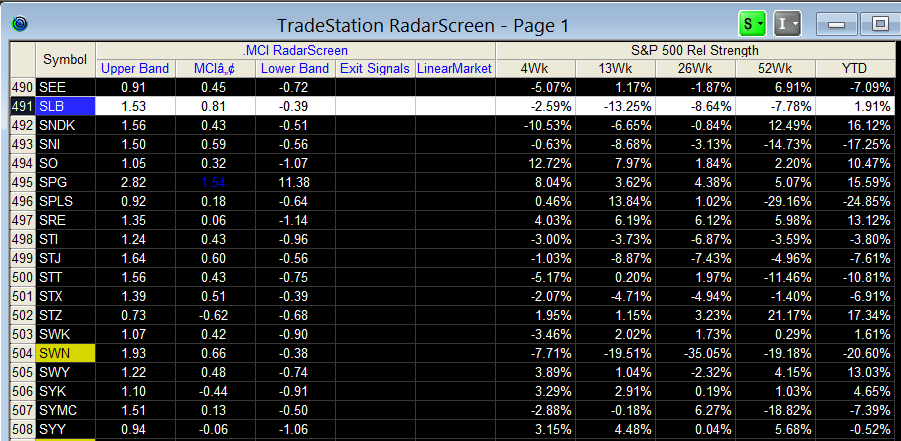
| Figure 2. Where Does It Rank? SLB continues to underperform the S&P 500 index (.SPX, SPY), despite its strong relief rally since October 17, 2014. |
| Graphic provided by: TradeStation. |
| Graphic provided by: TradeStation RadarScreen. |
| |
| Presently, SLB is attempting another rally and may soon touch the blue histogram; given that the stock has already made a 38% Fibonacci retracement of the entire decline from July-October 2014, this could be an important juncture for SLB and its peers in the oil industry group. A decisive breach above the blue zone may imply a larger 50% retracement (at 102.35) while another sharp rejection due to heavy supply near 98.00/98.50 may mean that the stock is intent on a test of the 86.00 low seen last week. |
| Knowing ahead of time where major supply/demand zones are on your charts can help you keep more of your gains, keep you out of low probability trade setups, and can also help you locate trades with minimal risk and high potential reward. For frustrated trend followers who always seem to be the victim of Lucy — as she pulls away the football at the last minute — learning to spot strong these powerful support/resistance zones can mean the difference between success and failure. Try to see the markets in terms of supply and demand zones and your trading results should improve substantially. Trade wisely until we meet here again. |
Freelance financial markets writer and online publisher of the Trendzetterz.com S&P 500 Weekly Forecast service.
| Title: | Market consultant and writer |
| Company: | Trendzetterz |
| Address: | 81 Hickory Hollow Drive |
| Crossville, TN 38555 | |
| Phone # for sales: | 904-303-4814 |
| Website: | trendzetterz.com |
| E-mail address: | support@trendzetterz.com |
Traders' Resource Links | |
| Trendzetterz has not added any product or service information to TRADERS' RESOURCE. | |
Click here for more information about our publications!
Comments
Date:�10/23/14Rank:�5Comment:�

Request Information From Our Sponsors
- StockCharts.com, Inc.
- Candle Patterns
- Candlestick Charting Explained
- Intermarket Technical Analysis
- John Murphy on Chart Analysis
- John Murphy's Chart Pattern Recognition
- John Murphy's Market Message
- MurphyExplainsMarketAnalysis-Intermarket Analysis
- MurphyExplainsMarketAnalysis-Visual Analysis
- StockCharts.com
- Technical Analysis of the Financial Markets
- The Visual Investor
- VectorVest, Inc.
- Executive Premier Workshop
- One-Day Options Course
- OptionsPro
- Retirement Income Workshop
- Sure-Fire Trading Systems (VectorVest, Inc.)
- Trading as a Business Workshop
- VectorVest 7 EOD
- VectorVest 7 RealTime/IntraDay
- VectorVest AutoTester
- VectorVest Educational Services
- VectorVest OnLine
- VectorVest Options Analyzer
- VectorVest ProGraphics v6.0
- VectorVest ProTrader 7
- VectorVest RealTime Derby Tool
- VectorVest Simulator
- VectorVest Variator
- VectorVest Watchdog