HOT TOPICS LIST
- MACD
- Fibonacci
- RSI
- Gann
- ADXR
- Stochastics
- Volume
- Triangles
- Futures
- Cycles
- Volatility
- ZIGZAG
- MESA
- Retracement
- Aroon
INDICATORS LIST
LIST OF TOPICS
PRINT THIS ARTICLE
by Koos van der Merwe
Another rumor hit the street today - shares of BlackBerry Ltd. soared 8.5%.
Position: Buy
Koos van der Merwe
Has been a technical analyst since 1969, and has worked as a futures and options trader with First Financial Futures in Johannesburg, South Africa.
PRINT THIS ARTICLE
FLAGS AND PENNANTS
Another Rumor To Watch
10/20/14 05:22:51 PMby Koos van der Merwe
Another rumor hit the street today - shares of BlackBerry Ltd. soared 8.5%.
Position: Buy
| The mantra as you know is "buy on the rumor and sell on the fact." On the morning of October 20, 2014 the anniversary of the October 1987 market crash, the rumor came out that Lenovo was making a bid for Blackberry Ltd.(BBRY), and the price of the share jumped. Is it too late to buy? What do the charts say? |

|
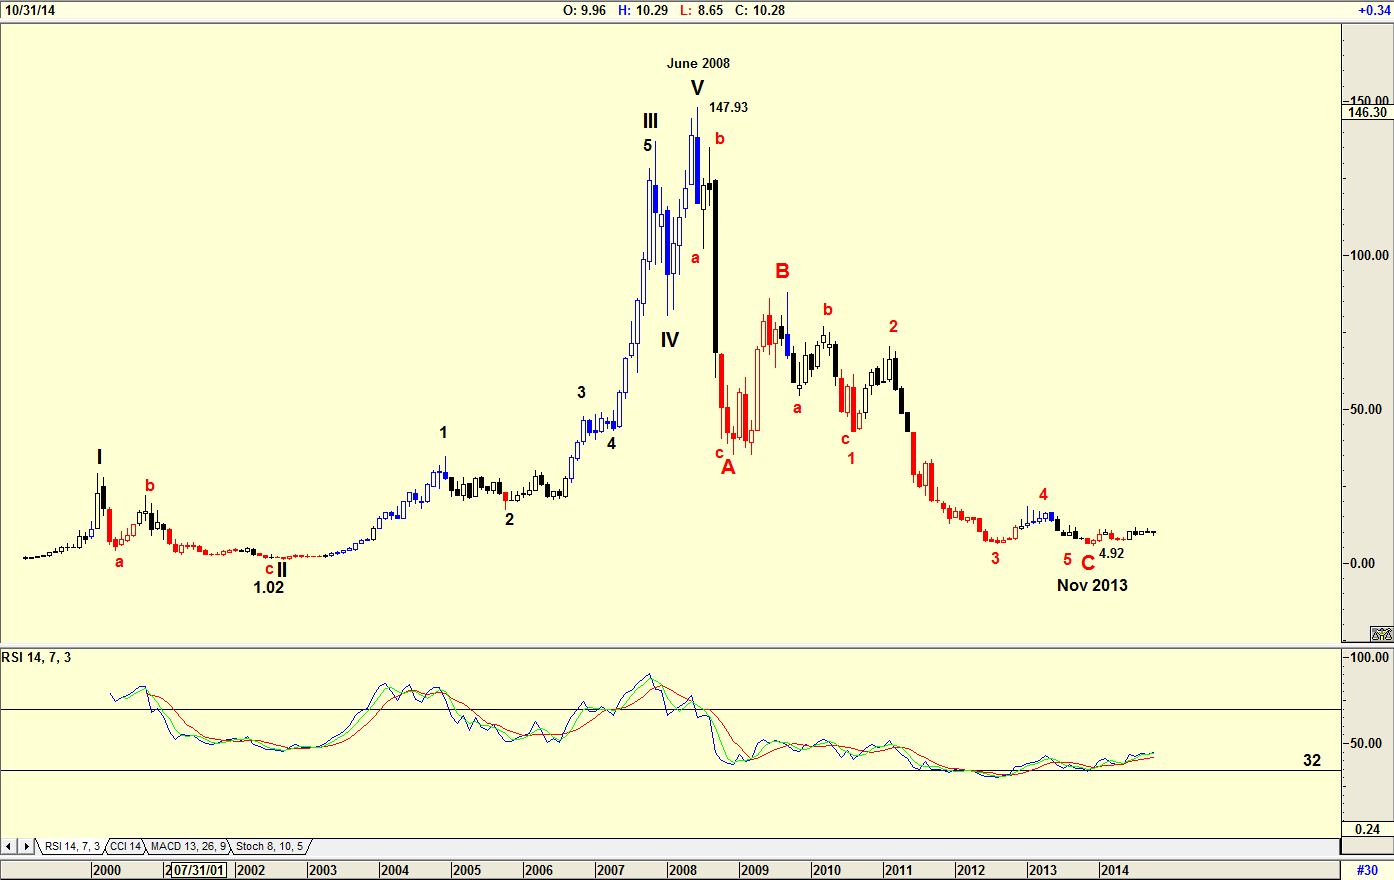
| Figure 1. Rise & Fall. Here you see a monthly chart of BlackBerry Ltd. showing the collapse of the share. |
| Graphic provided by: AdvancedGET. |
| |
| The chart in Figure 1 is a monthly chart showing how the share price fell from a high of $147.93 in June 2008 to a low of $4.92 by November 2013. The Elliott wave count suggests that the share price has bottomed in a WAVE C, however, although the relative strength index (RSI) has suggested a buy signal by falling below and then breaking above the 32 horizontal line. Traders and investors have been hesitant to buy the share because of fundamental reasons, namely can BBRY compete with Samsung and Apple. |

|
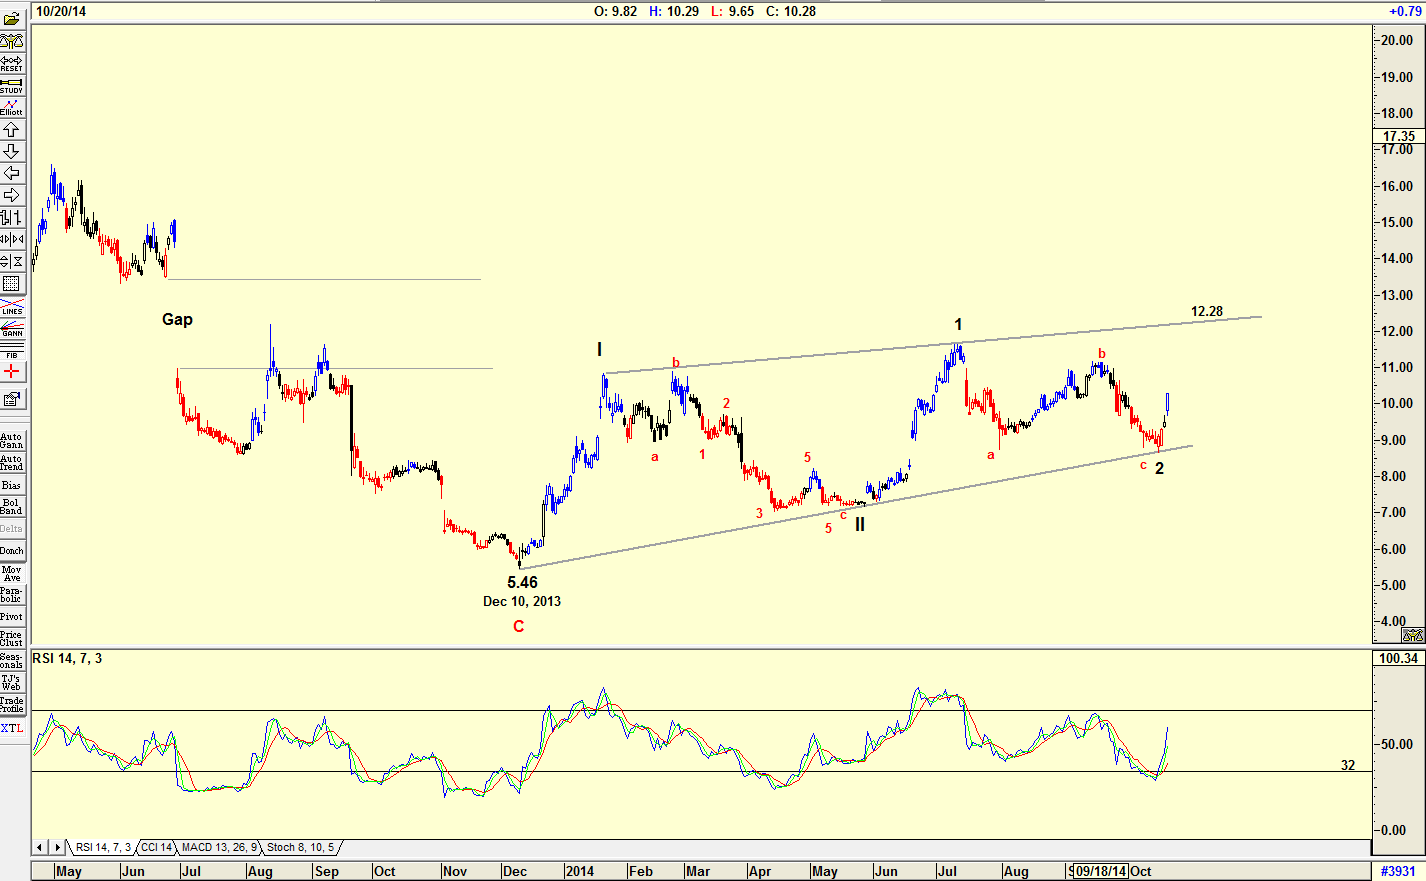
| Figure 2. Elliott Waves. Here you see the daily chart with the Elliott Waves overlaid on it. |
| Graphic provided by: AdvancedGET. |
| |
| The chart in Figure 2 is a daily chart with an optimistic view, namely that the share price could rise and test the upper resistance line at $12.28, and then rise above it in a wave 3 of WAVE III. This is confirmed by the RSI which has given a buy signal. |

|
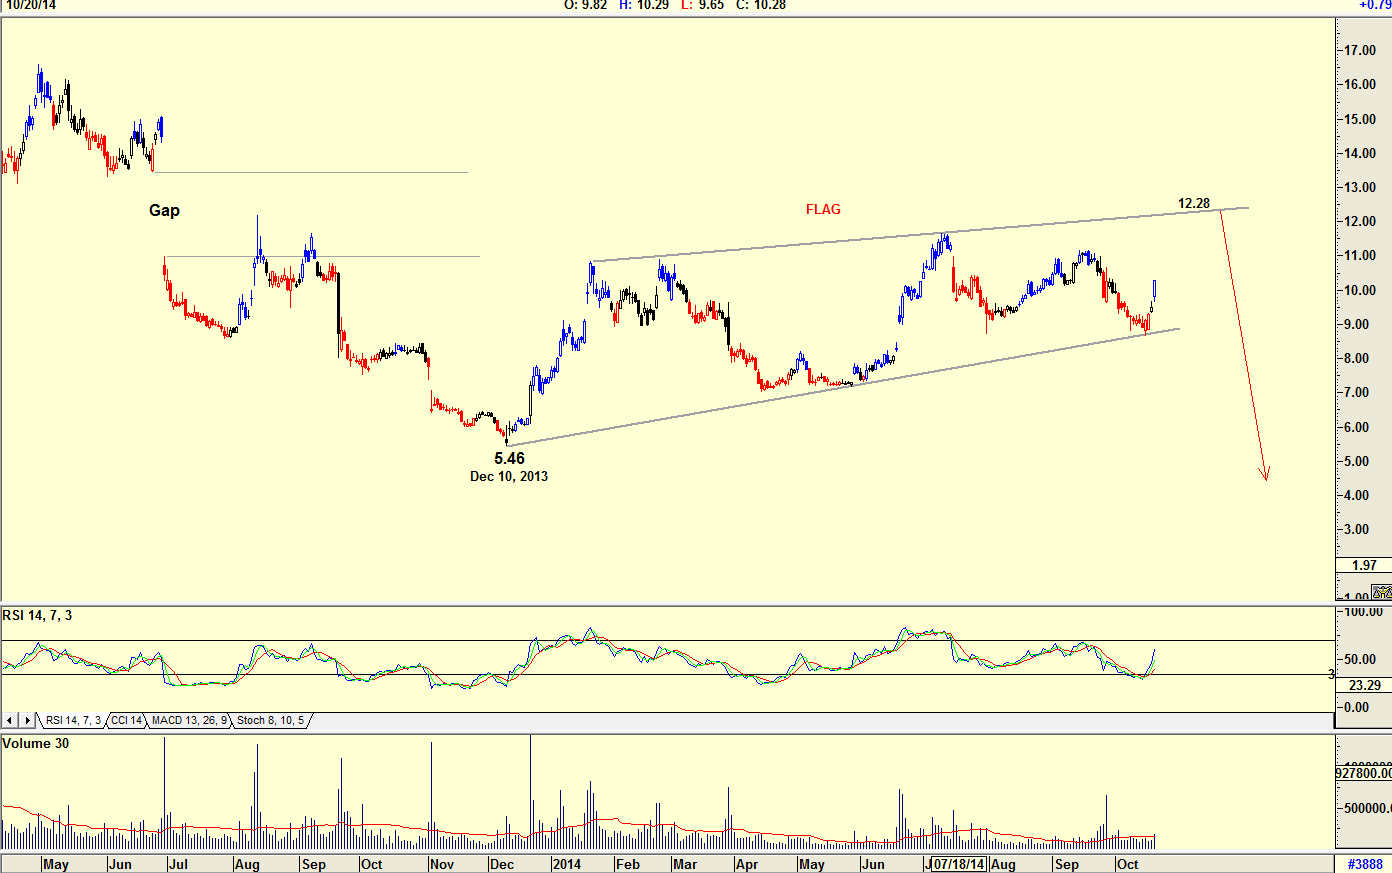
| Figure 3. Flag? Here you see a daily chart of BBRY suggesting a flag pattern. |
| Graphic provided by: AdvancedGET. |
| |
| The chart in Figure 3 is also a daily chart, suggesting that the share price is forming a flag in a down trending market. In order to be considered valid, a flag should conform to three rules: 1. They should occur after a very sharp up or down move. 2. Volume should decline throughout the duration of the pattern. 3.Prices should break out of the pattern within a few weeks. The chart shows that the pattern formed after a strong fall in share price. Volume could be considered below average with the exception of the occasional spike. You should now see whether the price will break down in matter of a few weeks. With a recent change in the leadership of the company, the future of the company has become an unknown, so the possibility of a takeover by another company could well and truly happen. Buying on the rumor could be risky, but the charts are suggesting a short-term buy to sell the share on the fact whether positive or negative. |
Has been a technical analyst since 1969, and has worked as a futures and options trader with First Financial Futures in Johannesburg, South Africa.
| Address: | 3256 West 24th Ave |
| Vancouver, BC | |
| Phone # for sales: | 6042634214 |
| E-mail address: | petroosp@gmail.com |
Click here for more information about our publications!
PRINT THIS ARTICLE

Request Information From Our Sponsors
- VectorVest, Inc.
- Executive Premier Workshop
- One-Day Options Course
- OptionsPro
- Retirement Income Workshop
- Sure-Fire Trading Systems (VectorVest, Inc.)
- Trading as a Business Workshop
- VectorVest 7 EOD
- VectorVest 7 RealTime/IntraDay
- VectorVest AutoTester
- VectorVest Educational Services
- VectorVest OnLine
- VectorVest Options Analyzer
- VectorVest ProGraphics v6.0
- VectorVest ProTrader 7
- VectorVest RealTime Derby Tool
- VectorVest Simulator
- VectorVest Variator
- VectorVest Watchdog
- StockCharts.com, Inc.
- Candle Patterns
- Candlestick Charting Explained
- Intermarket Technical Analysis
- John Murphy on Chart Analysis
- John Murphy's Chart Pattern Recognition
- John Murphy's Market Message
- MurphyExplainsMarketAnalysis-Intermarket Analysis
- MurphyExplainsMarketAnalysis-Visual Analysis
- StockCharts.com
- Technical Analysis of the Financial Markets
- The Visual Investor
