HOT TOPICS LIST
- MACD
- Fibonacci
- RSI
- Gann
- ADXR
- Stochastics
- Volume
- Triangles
- Futures
- Cycles
- Volatility
- ZIGZAG
- MESA
- Retracement
- Aroon
INDICATORS LIST
LIST OF TOPICS
PRINT THIS ARTICLE
by Donald W. Pendergast, Jr.
Shares of Altera fell by as much as 19% during its recent three-week slide; its latest rally looks to be of the bear market variety, with bigger declines ahead.
Position: N/A
Donald W. Pendergast, Jr.
Freelance financial markets writer and online publisher of the Trendzetterz.com S&P 500 Weekly Forecast service.
PRINT THIS ARTICLE
ALTR: Relief Rally In The Midst Of A Larger Downtrend?
10/22/14 05:12:07 PMby Donald W. Pendergast, Jr.
Shares of Altera fell by as much as 19% during its recent three-week slide; its latest rally looks to be of the bear market variety, with bigger declines ahead.
Position: N/A
| Sometimes, stocks sell off violently — as Netflix Inc. (NFLX) did last week — and at other times the declines are orderly and fairly easy to identify and trade. The recent correction in shares of Altera Corp. (ALTR) did indeed shave 19% in valuation in only three weeks, but look at how proportional the Elliott wave impulse patterns developed in that period; there are two degrees of five wave impulse patterns in the swing (i-v and (i)-(v), with the final low being seen on October 10, 2014 at 30.47). Now, with a solid relief rally underway, what is the technical situation going forward for ALTR? Let's look at a few clues that give a fairly good idea of what may unfold in this stock over the next couple of months. |

|
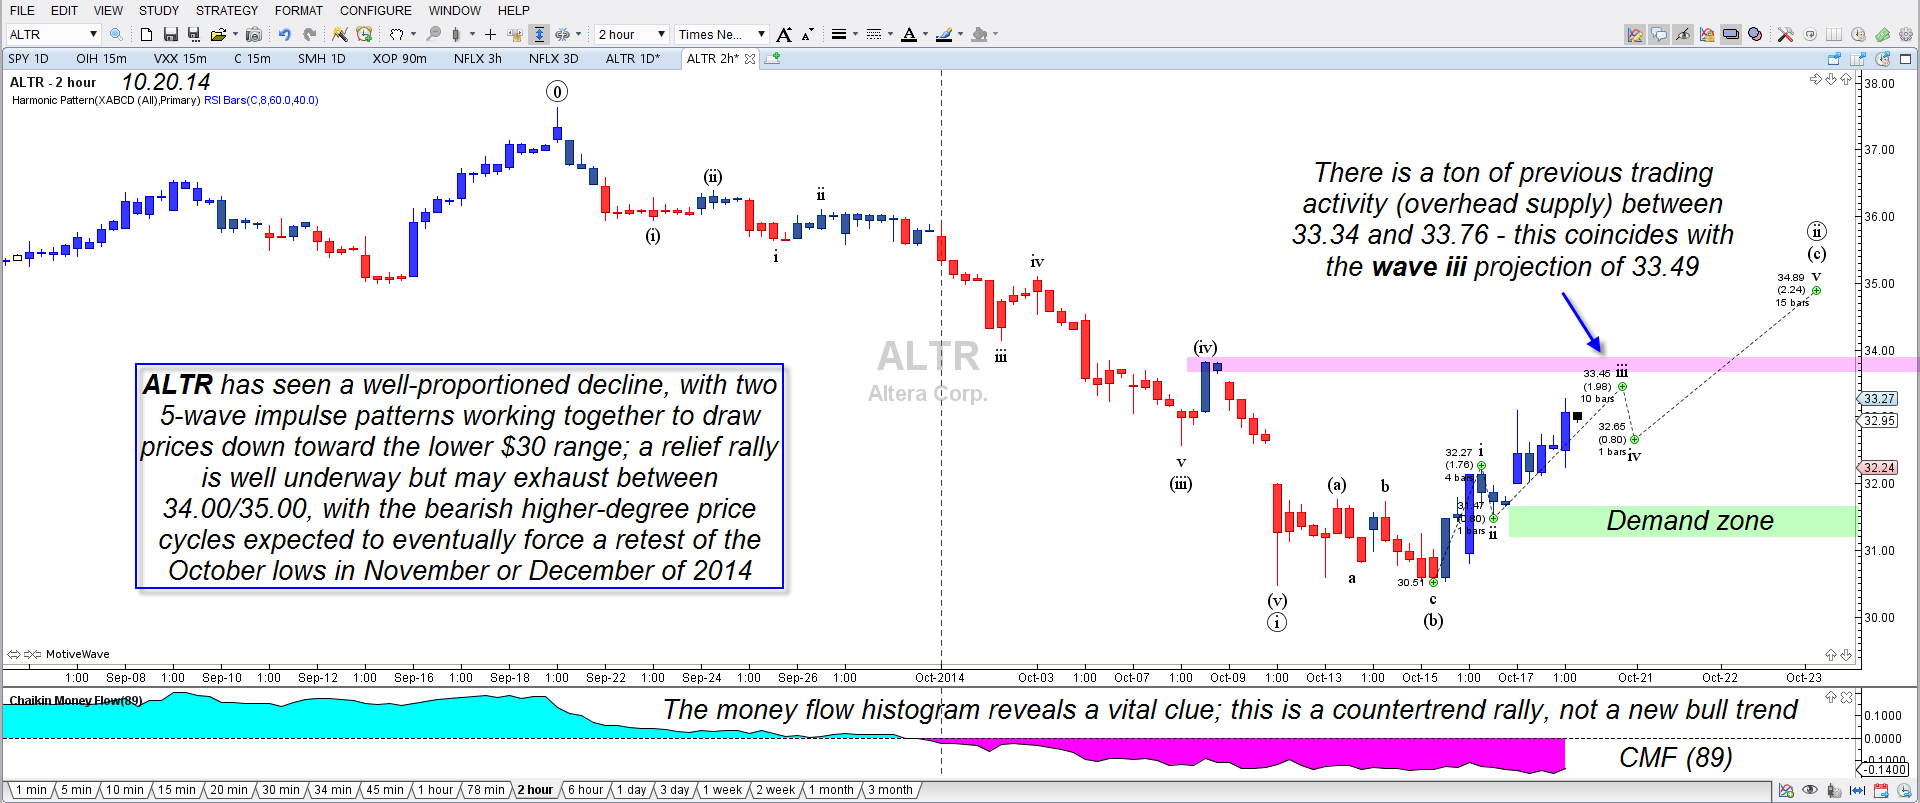
| Figure 1. Altera Inc. (ALTR): The stock is rapidly approaching an area of ultra-high historical trading volume near 33.50, which also coincides with the anticipated wave iii high at 33.45. |
| Graphic provided by: MotiveWave.com. |
| |
| Using the 120-minute chart (Figure 1), one of the obvious bearish biases here is the extremely negative long-term Chaikin money flow histogram (CMF)(89); the bounce higher since the October 10, 2014 low is a relief rally and the Elliott wave counts also concur: 1. The current advance is in wave iii and is anticipated to terminate at or before 33.45. 2. Wave ii on the daily chart is anticipated to terminate at or before 34.89, so ALTR is a little more than halfway to that price zone already. 3. The overall Elliott wave pattern is decidedly bearish, particularly due to the forecast of a bearish five-wave impulse pattern ahead, one that may take the stock into the lower $20.00 range. |

|
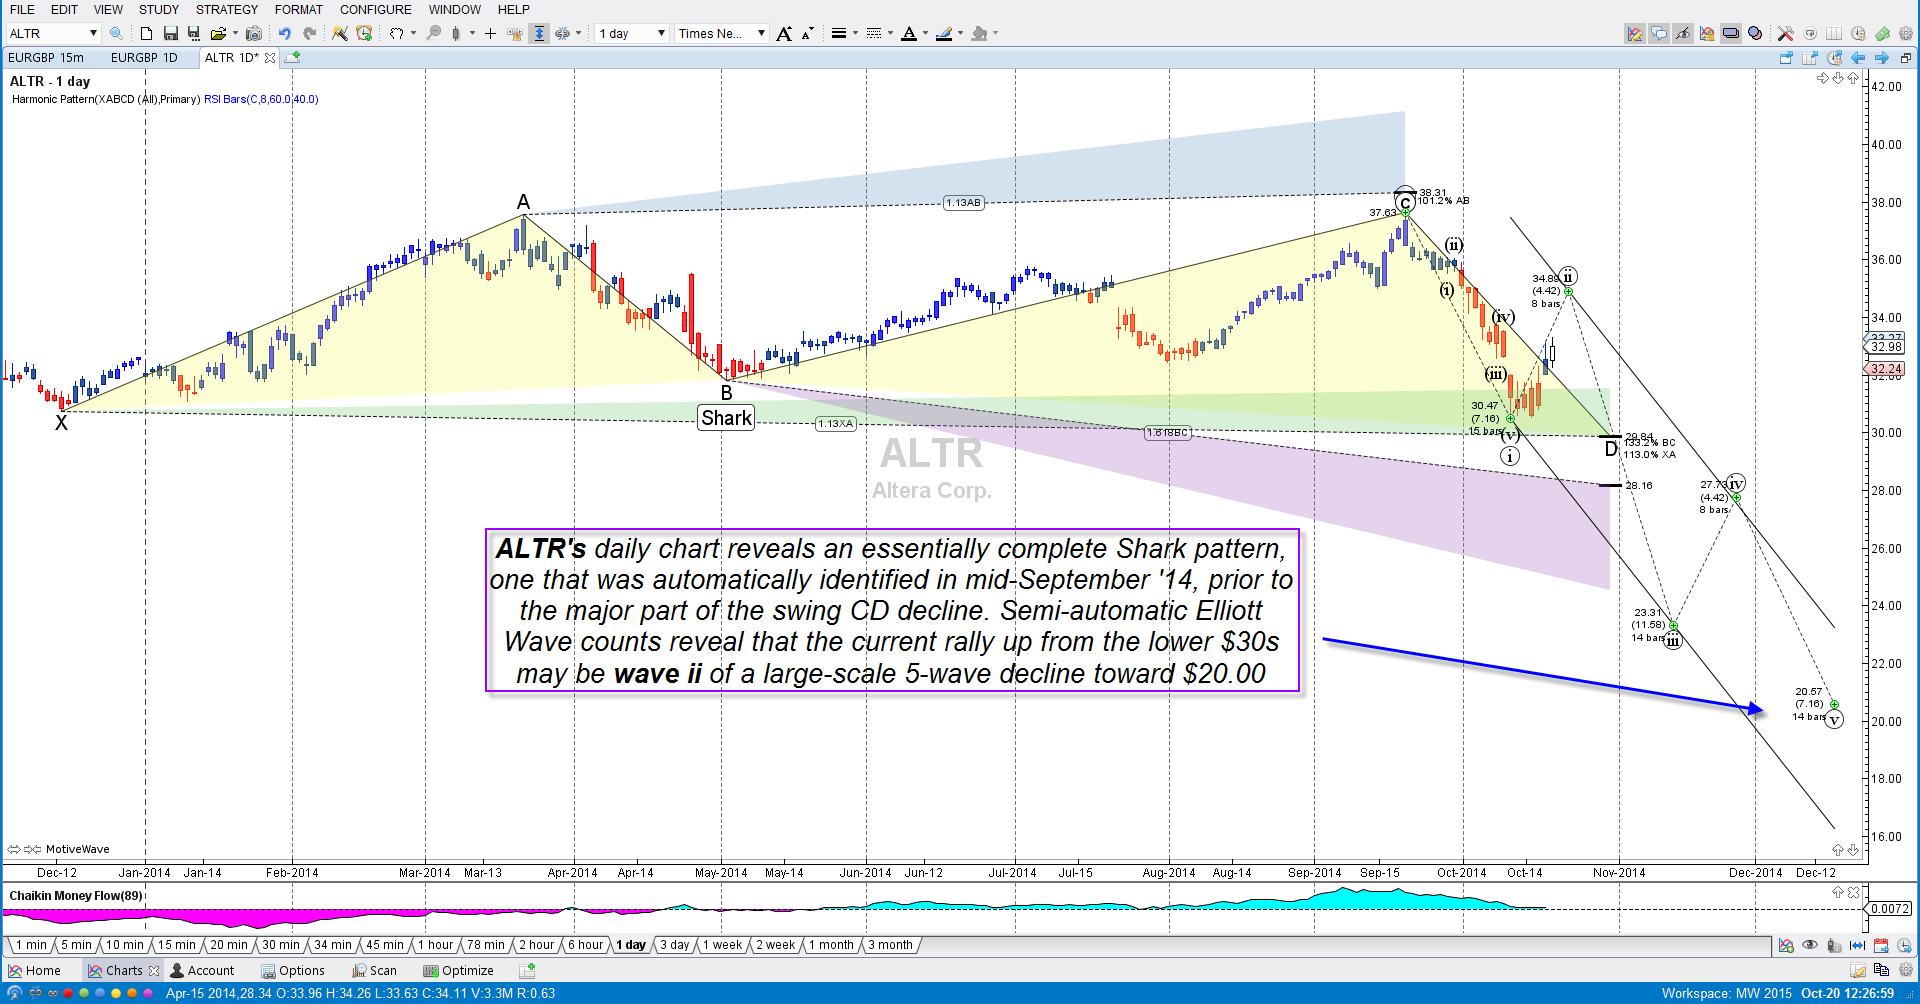
| Figure 2. Shark Harmonic Pattern. ALTR's current relief rally may ultimately prove to be wave ii of a large bearish five-wave impulse pattern that may bottom out in the lower $20.00 range. |
| Graphic provided by: MotiveWave.com. |
| |
| ALTR's daily chart in Figure 2 shows a Shark harmonic pattern; for all intents and purposes, the October 10, 2014 low at 30.47 completes most of the initial price target range for the CD swing, but note that point D is at 29.84 and that the violet extension for a deeper decline extends all the way down to 24.00. Given that the Elliott wave forecast is for a move way down into the lower $20s, this would be a good pattern to use as a guide should the selling in ALTR really get going after a bit more rally from here. ALTR, the semiconductor industry group and the Nasdaq 100 (QQQ) are all in general agreement in this bear market bounce as far as wave counts and chart patterns; look for ALTR to top no higher than 33.80, followed by the initial stages of a five wave of a larger wave 3 pattern to develop. Be very cautious if going long ALTR, SMH, or QQQ for more than a day or two, because once the selling kicks in again it may have the same intensity as seen over the past month or so. If or when ALTR makes it above 33.40 again, start looking for bearish reversal candles and other tell-tale 'time to go short' signals. Keep your trade risks modest and stay abreast of the patterns and Elliott wave counts presented above, should ALTR start heading down again in the next week or so — or less. Trade wisely until we meet here again. |
Freelance financial markets writer and online publisher of the Trendzetterz.com S&P 500 Weekly Forecast service.
| Title: | Market consultant and writer |
| Company: | Trendzetterz |
| Address: | 81 Hickory Hollow Drive |
| Crossville, TN 38555 | |
| Phone # for sales: | 904-303-4814 |
| Website: | trendzetterz.com |
| E-mail address: | support@trendzetterz.com |
Traders' Resource Links | |
| Trendzetterz has not added any product or service information to TRADERS' RESOURCE. | |
Click here for more information about our publications!
PRINT THIS ARTICLE

|

Request Information From Our Sponsors
- StockCharts.com, Inc.
- Candle Patterns
- Candlestick Charting Explained
- Intermarket Technical Analysis
- John Murphy on Chart Analysis
- John Murphy's Chart Pattern Recognition
- John Murphy's Market Message
- MurphyExplainsMarketAnalysis-Intermarket Analysis
- MurphyExplainsMarketAnalysis-Visual Analysis
- StockCharts.com
- Technical Analysis of the Financial Markets
- The Visual Investor
- VectorVest, Inc.
- Executive Premier Workshop
- One-Day Options Course
- OptionsPro
- Retirement Income Workshop
- Sure-Fire Trading Systems (VectorVest, Inc.)
- Trading as a Business Workshop
- VectorVest 7 EOD
- VectorVest 7 RealTime/IntraDay
- VectorVest AutoTester
- VectorVest Educational Services
- VectorVest OnLine
- VectorVest Options Analyzer
- VectorVest ProGraphics v6.0
- VectorVest ProTrader 7
- VectorVest RealTime Derby Tool
- VectorVest Simulator
- VectorVest Variator
- VectorVest Watchdog
