

HOT TOPICS LIST
- MACD
- Fibonacci
- RSI
- Gann
- ADXR
- Stochastics
- Volume
- Triangles
- Futures
- Cycles
- Volatility
- ZIGZAG
- MESA
- Retracement
- Aroon
INDICATORS LIST
LIST OF TOPICS
PRINT THIS ARTICLE
by Donald W. Pendergast, Jr.
Harmonic price patterns can be powerful, especially when other key technicals are in agreement.
Position: N/A
Donald W. Pendergast, Jr.
Freelance financial markets writer and online publisher of the Trendzetterz.com S&P 500 Weekly Forecast service.
PRINT THIS ARTICLE
CHART ANALYSIS
NFLX: Harmonic Pattern Proving Out
10/17/14 06:12:28 PMby Donald W. Pendergast, Jr.
Harmonic price patterns can be powerful, especially when other key technicals are in agreement.
Position: N/A
| After disappointing Wall Street by failing to meet its own forecasts for Q3 subscriber growth, shares of Netflix Inc. (NFLX) plunged in after-hours trading by 26% on October 15, 2014. Was this sudden sell-off solely the result of a missed financial forecast or were there prior significant technical clues warning of a major decline? Here's a closer look to see. |
|
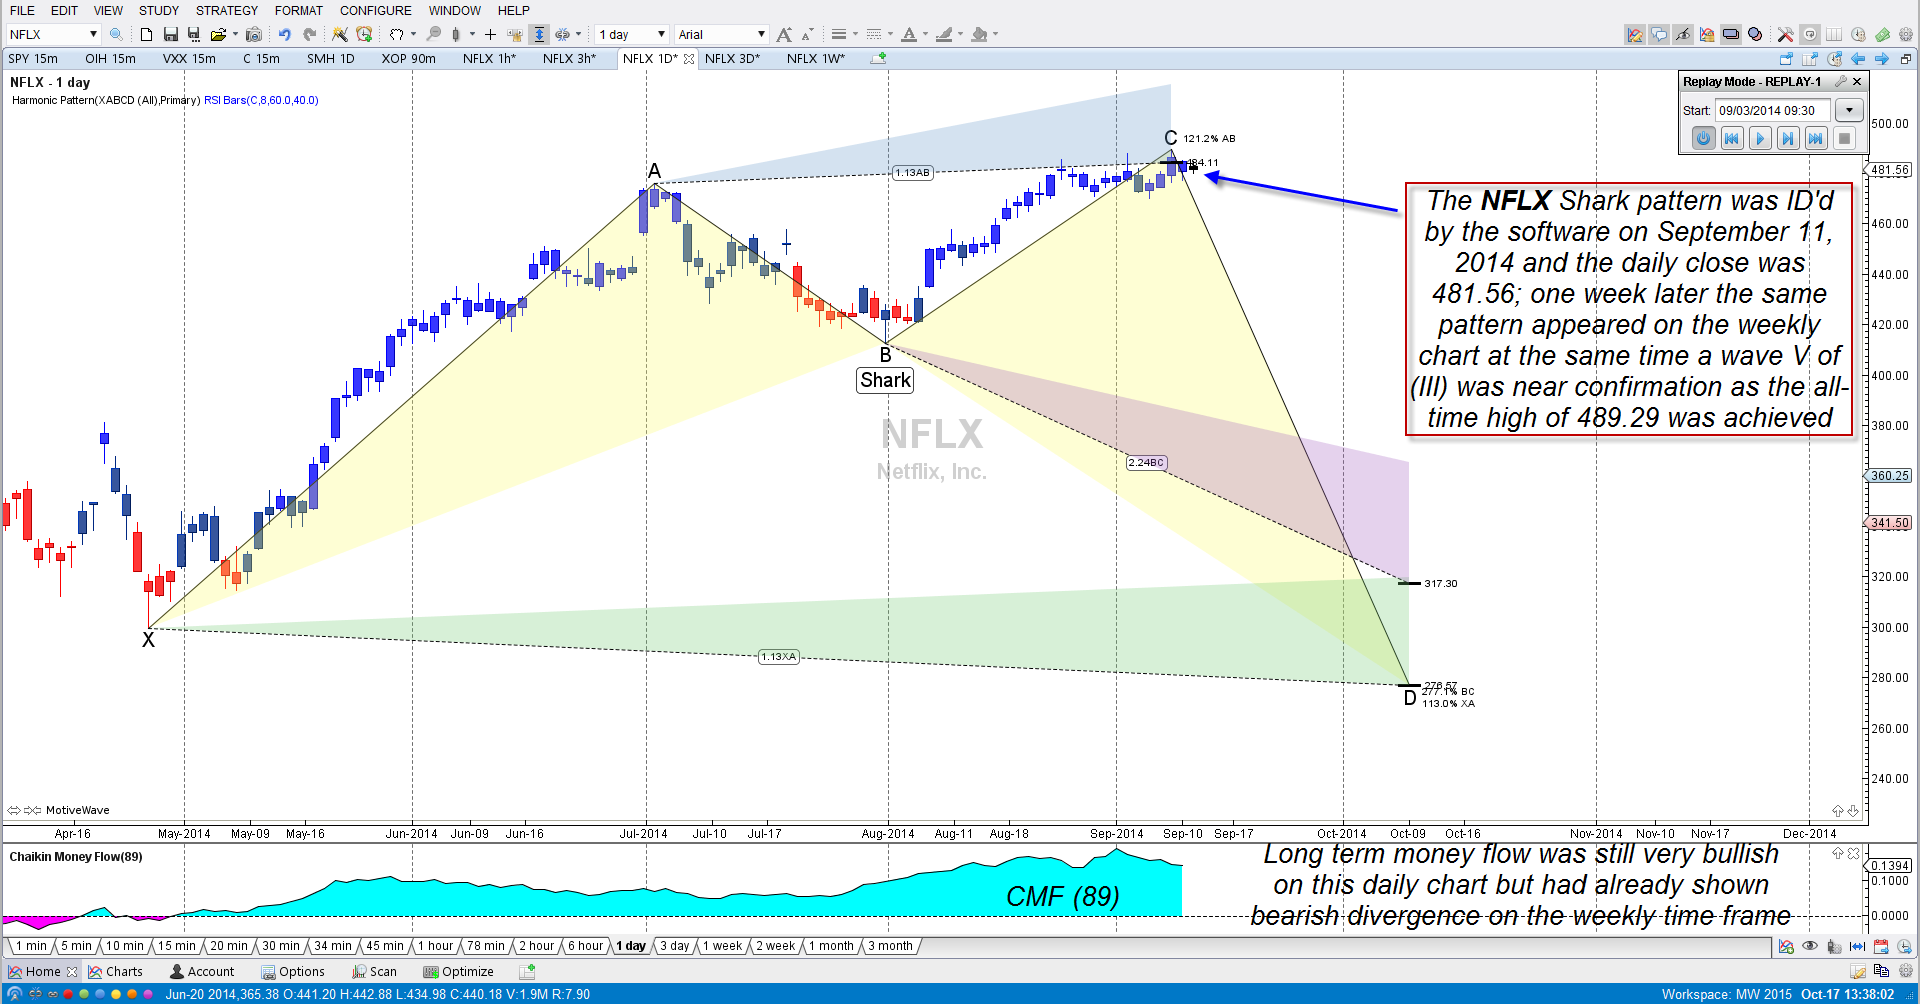
| Figure 1. Netflix Inc. (NFLX): The daily Shark harmonic pattern appeared only two trading sessions after the stock made its all-time high of 489.29 (September 9, 2014) at the same time an Elliott wave V of (III) was terminating on the weekly chart. |
| Graphic provided by: MotiveWave.com. |
| |
| It's doubtful that any investor or trader would have had any idea that the sharp sell-off in NFLX (on October 15, 2014 post-market trading) was coming, much less how deep and scarifying it was for long-term investors in the stock. It's true that NFLX does have a history of sharp moves once its latest quarterly earnings are released, but very few have ever resulted in as much of a rout as this particular gap — one good for a 26% haircut in just a few minutes. Yet, to savvy technicians, the so-called "writing on the wall" for the stock appeared more than a month prior to the surprise liquidation on October 15, 2014: 1. NFLX's weekly chart was in a long term uptrend that was similar to the one seen between May 2009-July 2011 and had a similar angle of attack, percentage gain and elapsed time since origination. 2. Elliott wave counts also revealed that NFLX was most likely in a final wave 5 advance of a larger wave (III) pattern. 3. A weekly Shark harmonic pattern had appeared in the second half of September 2014. 4. A daily Shark pattern also manifested on NFLX's daily chart (Figure 1), as of the close on September 11, 2014. This was only two trading sessions after the all-time high of 489.29 had been reached by the stock. 5. The 34-week Chaikin Money flow (CMF)(34) was also depicting a sharply bearish divergence with price. The two respective harmonic patterns made a good case for some amount of a correction coming, but when combined with the Elliott wave count, similar mania uptrend dynamics with the prior bull run and waning weekly money flow, suddenly the Shark pattern looked menacing indeed - like a ravenous ocean predator waiting for the next round of stock market sheep slaughter to happen. The disappointing Q3 growth news from the company was simply the catalyst that got the previously 'baked in' technical recipe for a heavy decline rolling at full speed, and was not the primary reason for the decline, contrary to what the talking heads on TV were saying about the stock. |
|
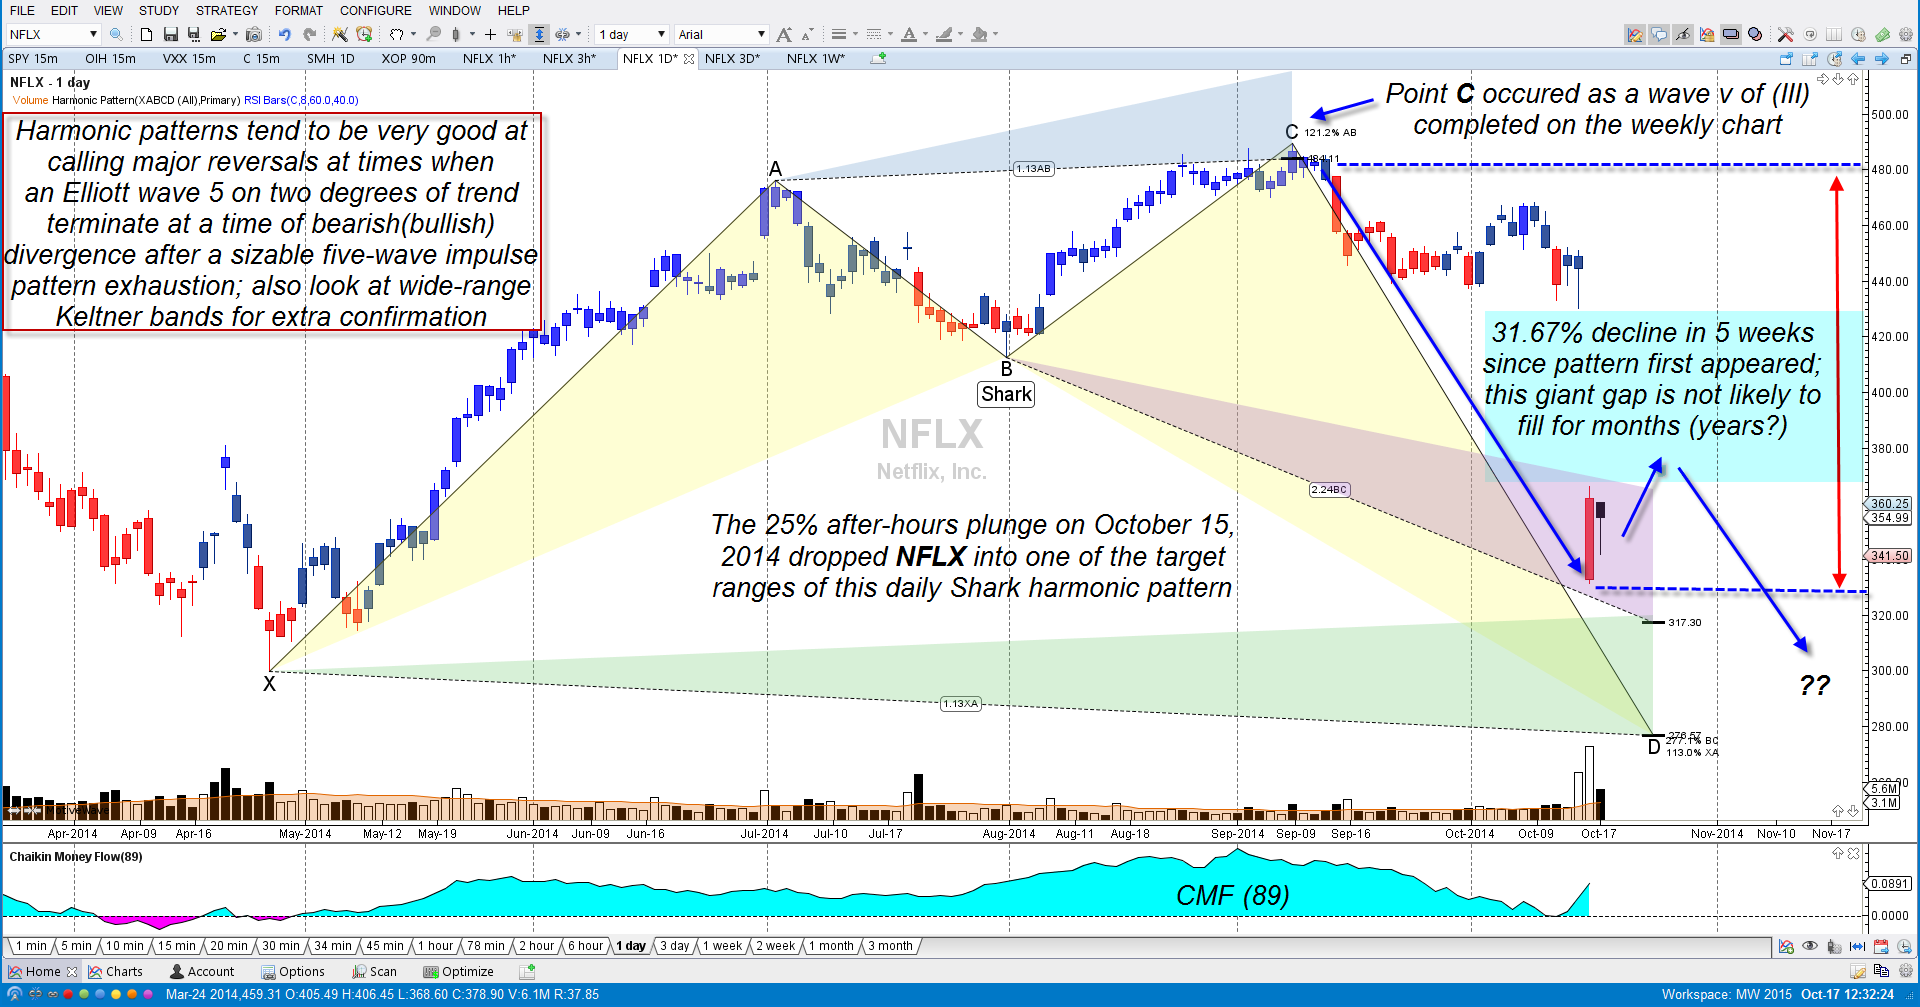
| Figure 2. NFLXs negative Q3 news did play a part in the giant sell-off in the October 15, 2014 post-market session, but the Elliott wave, harmonic pattern, money flow, and bull run 'mania' factors were the primary forces setting the stage for the rout. |
| Graphic provided by: MotiveWave.com. |
| |
| And for any new trader wondering what the most probable pathway for NFLX prices are in the next six to 12 months, just take a look at the size of that open gap on the chart (blue zone); most skilled traders/technicians would concur that this was the event that ended NFLX's recent 27 1/2 month, incredible bull run, and that even lower valuations are much more likely before any kind of new bull market can take root in this stock. Current Elliot counts also reveal the current downswing is wave C of a 3-wave corrective pattern (daily chart in Figure 2) and that meaningful support/wave termination levels won't be seen until the 300.00-310.00 price level. The weekly Elliot count also agrees that the 300.00 area should provide some support — and a relief rally of some degree. Skilled traders might seek out possible short-term long entry points near 300.00, using 30-, 60- or 90-minute charts and modest amounts of risk capital. Long-term investors should be aware that the last weekly wave V termination in July 2011 set the stage for a 79% decline that took only 4 1/2 months to complete; be very cautious if considering averaging down or dollar cost averaging. The next multi-day rally off of lower support levels also sets the stage for a put option buying bonanza — if the gap fails to fill (95% probable it won't this year) after a bounce from the lower $300s, the time would be opportune to start shorting once again. History never repeats exactly the same, but the odds favor substantially lower prices for NFLX into at least the second half of 2015. Trade wisely until we meet here again. |
Freelance financial markets writer and online publisher of the Trendzetterz.com S&P 500 Weekly Forecast service.
| Title: | Market consultant and writer |
| Company: | Trendzetterz |
| Address: | 81 Hickory Hollow Drive |
| Crossville, TN 38555 | |
| Phone # for sales: | 904-303-4814 |
| Website: | trendzetterz.com |
| E-mail address: | support@trendzetterz.com |
Traders' Resource Links | |
| Trendzetterz has not added any product or service information to TRADERS' RESOURCE. | |
Click here for more information about our publications!
Comments
Date:�10/23/14Rank:�2Comment:�The Shark harmonic pattern was never defined. What is it?

Request Information From Our Sponsors
- StockCharts.com, Inc.
- Candle Patterns
- Candlestick Charting Explained
- Intermarket Technical Analysis
- John Murphy on Chart Analysis
- John Murphy's Chart Pattern Recognition
- John Murphy's Market Message
- MurphyExplainsMarketAnalysis-Intermarket Analysis
- MurphyExplainsMarketAnalysis-Visual Analysis
- StockCharts.com
- Technical Analysis of the Financial Markets
- The Visual Investor
- VectorVest, Inc.
- Executive Premier Workshop
- One-Day Options Course
- OptionsPro
- Retirement Income Workshop
- Sure-Fire Trading Systems (VectorVest, Inc.)
- Trading as a Business Workshop
- VectorVest 7 EOD
- VectorVest 7 RealTime/IntraDay
- VectorVest AutoTester
- VectorVest Educational Services
- VectorVest OnLine
- VectorVest Options Analyzer
- VectorVest ProGraphics v6.0
- VectorVest ProTrader 7
- VectorVest RealTime Derby Tool
- VectorVest Simulator
- VectorVest Variator
- VectorVest Watchdog