

HOT TOPICS LIST
- MACD
- Fibonacci
- RSI
- Gann
- ADXR
- Stochastics
- Volume
- Triangles
- Futures
- Cycles
- Volatility
- ZIGZAG
- MESA
- Retracement
- Aroon
INDICATORS LIST
LIST OF TOPICS
PRINT THIS ARTICLE
by Donald W. Pendergast, Jr.
Shares of the SPDR S&P Oil and Gas Exploration ETF have literally gone over the proverbial cliff, but two key technicals say the selling may be overdone.
Position: N/A
Donald W. Pendergast, Jr.
Freelance financial markets writer and online publisher of the Trendzetterz.com S&P 500 Weekly Forecast service.
PRINT THIS ARTICLE
ELLIOTT WAVE
XOP: Exhaustion Of Current Rout?
10/15/14 02:25:42 PMby Donald W. Pendergast, Jr.
Shares of the SPDR S&P Oil and Gas Exploration ETF have literally gone over the proverbial cliff, but two key technicals say the selling may be overdone.
Position: N/A
| With so many serious news events working overtime to help drive down a previously overheated US stock market, a state of modest panic appears to have set in among investors, causing the wholesale dumping of stocks — the good along with the bad. The energy sector, and in particular the oil and gas exploration industry group, has been hit exceedingly hard since peaking late in June 2014; now down nearly 38% after accelerating sharply lower in the last six weeks, some powerful leading technical indicators are suggesting that the worst of XOP's rout may now be over, with the likely bullish bounce/relief rally approaching soon. Here's a closer look now. |
|
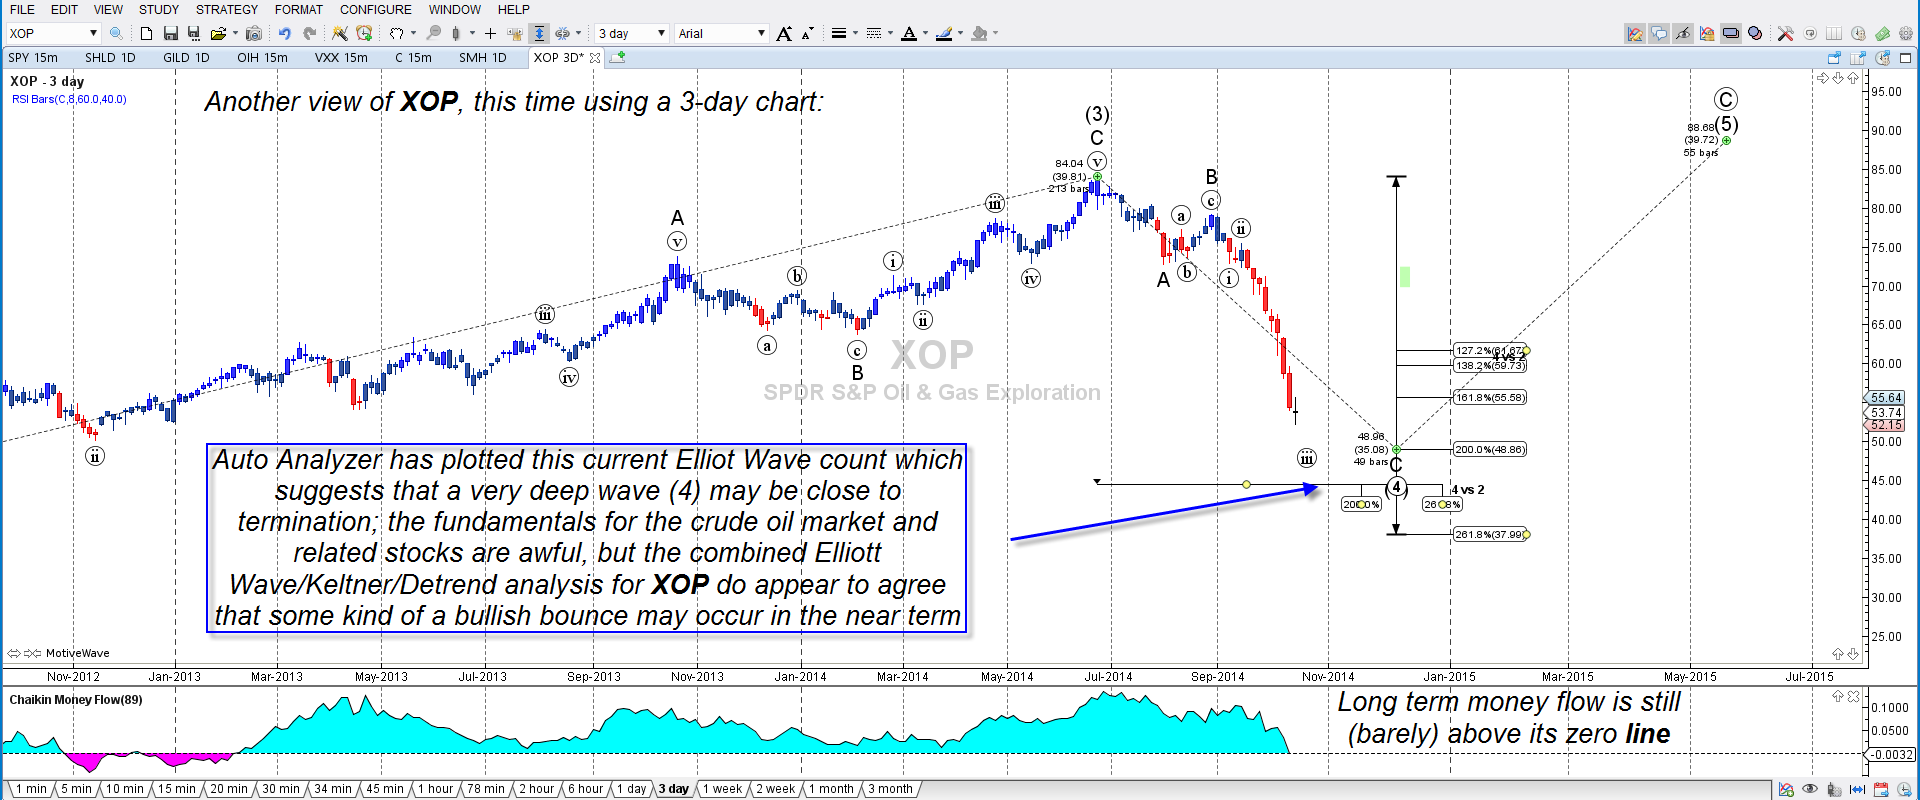
| Figure 1. SPDR Oil And Gas Exploration ETF (XOP): Down by as much as 38% since late June 2014,note that the long-term money flow remains (barely) positive even as this ETF descends toward a likely wave (4) termination area. |
| Graphic provided by: MotiveWave.com. |
| |
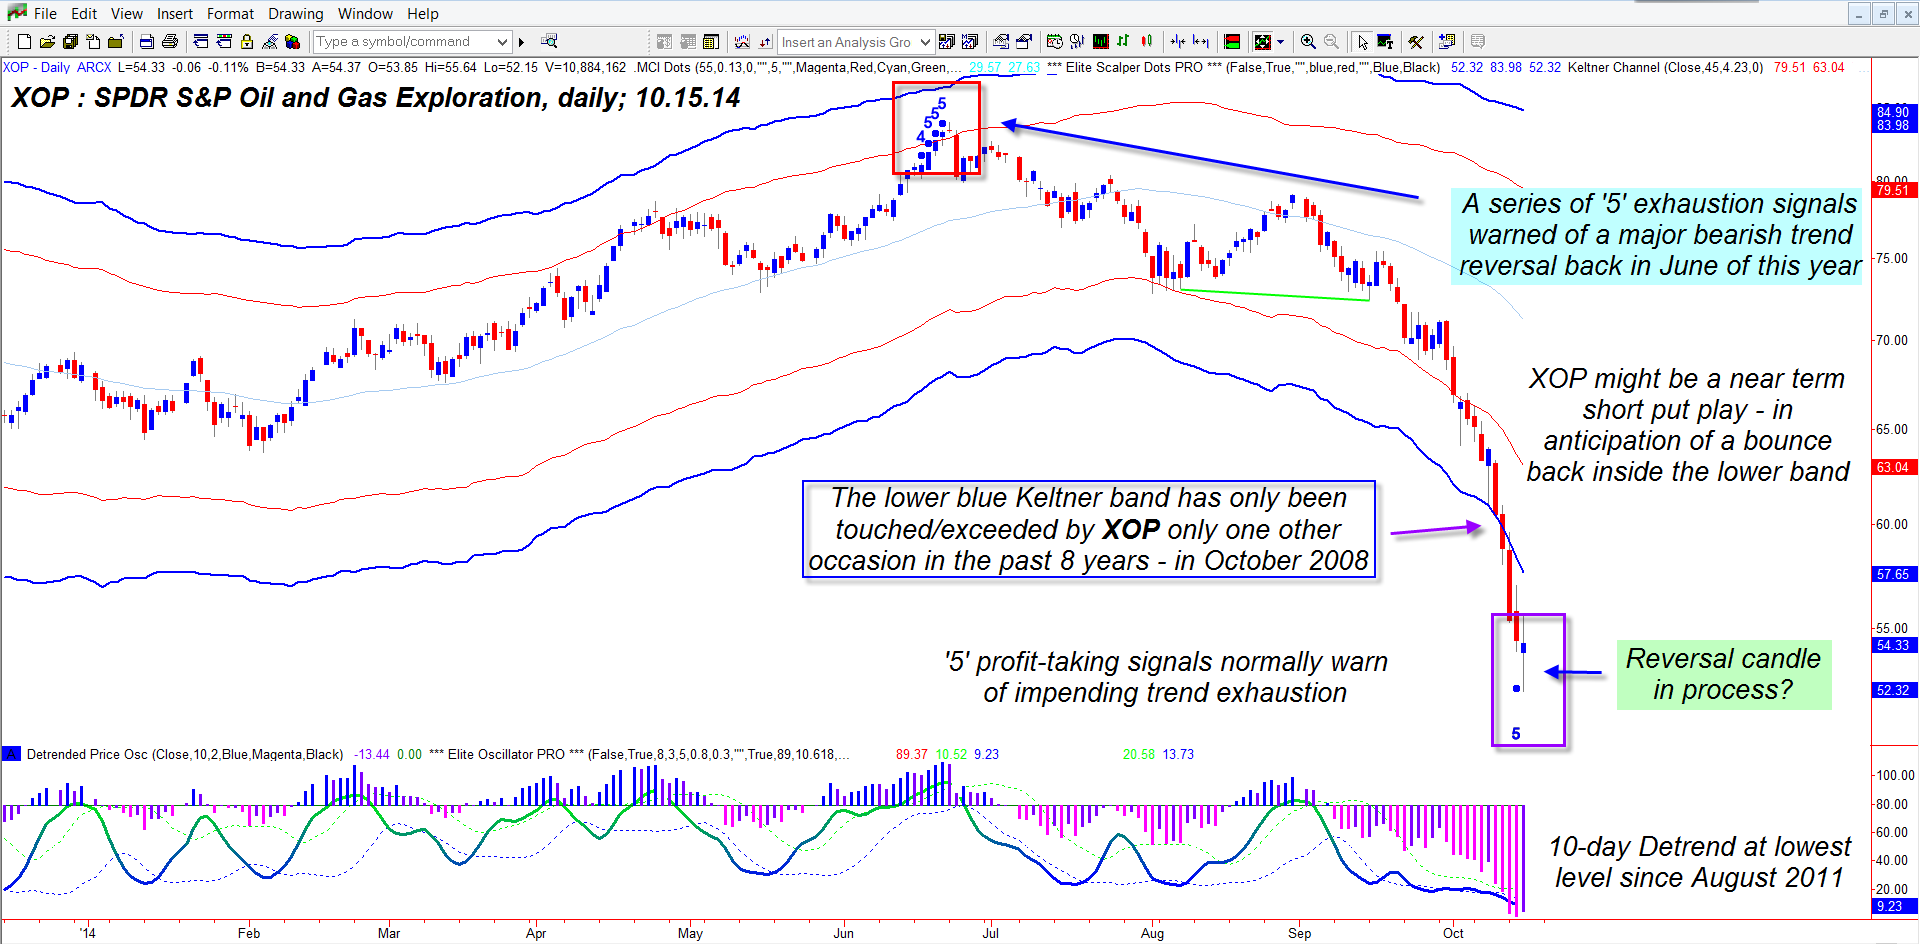
| Starting with the MotiveWave Elliott Wave three-day chart (Figure 1), the Auto Analyze function has plotted an interesting wave count; this deep wave (4) correction could be approaching an important time/price termination zone sometime between now and early December 2014. As each new price bar is plotted, the wave count will automatically update, but only if a dramatically different primary wave count is discovered by the software. Notice that the long term Chaikin Money Flow (CMF)(89) — incredibly — still has not crossed beneath its zero line, even after a mind-shattering selloff. This in no way implies a strong rally ahead but does suggest that the "smart money" are going to be building a position in the beaten-down stocks in this group; tickers to watch for possible signs of short-covering and relief rallies include, RIG, DO, CXO, APA and APC, among others. The Keltner channel chart for XOP in Figure 2 also reveals useful clues regarding a short-covering bounce ahead: 1. The daily closes beneath the bottom-most band are the first such occurrences in more than eight years; there was a brief touch of the band in the October 2008 market-wide debacle as well. While this highlights the extreme weakness of XOP, in most cases such extreme overshoots of statistically important support are quickly reversed, with such stocks moving back up to close back above the lower band in a relatively short period of time. 2. The 10-day detrend oscillator is at the lowest reading since the heavy selling seen in August 2011. 3. The elite oscillator PRO (beneath detrend) is also stretched far below its normal levels. 4. The '5' exhaustion/profit taking signal has occurred in concert with a bullish looking reversal candle. The near-term (long term?) fundamentals for the crude oil/natural gas markets are abysmal — too much supply and falling demand — for explorers/producers/servicers but are just peachy for John Q. Motorist and Suzy D. Homemaker, so don't expect too much of a bullish reversal in XOP anytime soon; but a bounce is going to happen, probably sooner than later based on the above Elliott, Keltner, money flow, and detrend analysis. |
|
| Figure 2. Keltner Channels. XOP's recent take-out of its extreme lower Keltner channel also suggests that a rebound of some degree is likely soon; note the '5' exhaustion signal and the ultra-extended Detrend oscillator. |
| Graphic provided by: TradeStation. |
| Graphic provided by: Elite Trader Indicators by Fibozachi.com. |
| |
| Aggressive traders can use 30-, 60-, and 120-minute charts to help time a bullish bounce but only after Wednesday's (October 15, 2014) high of 55.64 is taken out. Look for a potential rally back to at least the lower Keltner band — currently at 57.60 — if a true round of short covering erupts within the next few trading sessions. If that happens, then start looking for another opportunity to go short, as a retest of these new lows (52.15) becomes a high probability event. Trade wisely until we meet here again. |
Freelance financial markets writer and online publisher of the Trendzetterz.com S&P 500 Weekly Forecast service.
| Title: | Market consultant and writer |
| Company: | Trendzetterz |
| Address: | 81 Hickory Hollow Drive |
| Crossville, TN 38555 | |
| Phone # for sales: | 904-303-4814 |
| Website: | trendzetterz.com |
| E-mail address: | support@trendzetterz.com |
Traders' Resource Links | |
| Trendzetterz has not added any product or service information to TRADERS' RESOURCE. | |
Click here for more information about our publications!
PRINT THIS ARTICLE

Request Information From Our Sponsors
- StockCharts.com, Inc.
- Candle Patterns
- Candlestick Charting Explained
- Intermarket Technical Analysis
- John Murphy on Chart Analysis
- John Murphy's Chart Pattern Recognition
- John Murphy's Market Message
- MurphyExplainsMarketAnalysis-Intermarket Analysis
- MurphyExplainsMarketAnalysis-Visual Analysis
- StockCharts.com
- Technical Analysis of the Financial Markets
- The Visual Investor
- VectorVest, Inc.
- Executive Premier Workshop
- One-Day Options Course
- OptionsPro
- Retirement Income Workshop
- Sure-Fire Trading Systems (VectorVest, Inc.)
- Trading as a Business Workshop
- VectorVest 7 EOD
- VectorVest 7 RealTime/IntraDay
- VectorVest AutoTester
- VectorVest Educational Services
- VectorVest OnLine
- VectorVest Options Analyzer
- VectorVest ProGraphics v6.0
- VectorVest ProTrader 7
- VectorVest RealTime Derby Tool
- VectorVest Simulator
- VectorVest Variator
- VectorVest Watchdog