

HOT TOPICS LIST
- MACD
- Fibonacci
- RSI
- Gann
- ADXR
- Stochastics
- Volume
- Triangles
- Futures
- Cycles
- Volatility
- ZIGZAG
- MESA
- Retracement
- Aroon
INDICATORS LIST
LIST OF TOPICS
PRINT THIS ARTICLE
by Koos van der Merwe
Buying stocks based on a rumor is not easy, but the rule is to buy on the rumor and sell on the fact.
Position: Accumulate
Koos van der Merwe
Has been a technical analyst since 1969, and has worked as a futures and options trader with First Financial Futures in Johannesburg, South Africa.
PRINT THIS ARTICLE
ELLIOTT WAVE
Rumors, Rumors, And More Rumors
10/14/14 05:09:59 PMby Koos van der Merwe
Buying stocks based on a rumor is not easy, but the rule is to buy on the rumor and sell on the fact.
Position: Accumulate
| In today's market with a large number of so-called expert analysts emailing you with an opinion based on rumor, do you do your own research and analysis or do you simply follow their advice and buy? One of the shares that came to my attention by a report in a well-known newsletter, Seeking Alpha, a few months ago, is the share 3D Systems Corp. (DDD). The writer suggested that Hewlett-Packard Co. could be a buyer of the company. With the publication of his article the share price jumped almost $10 as short sellers covered their positions. Nothing happened, and the share price promptly dropped as short sellers re-entered the market. With Meg Whitman recently announcing the split of Hewlett-Packard into two companies, HP Inc., its consumer PC and printer business and Hewlett-Packard Enterprise, its hardware and software line, the rumor now circulating is, "Will HP Inc. develop its own 3-D printers or will the newly formed company purchase 3D Systems Corp.?" The recent drop in the share price of DDD suggests that HP Inc. will develop its own 3-D printers, or will it? What do the charts tell us? |
|
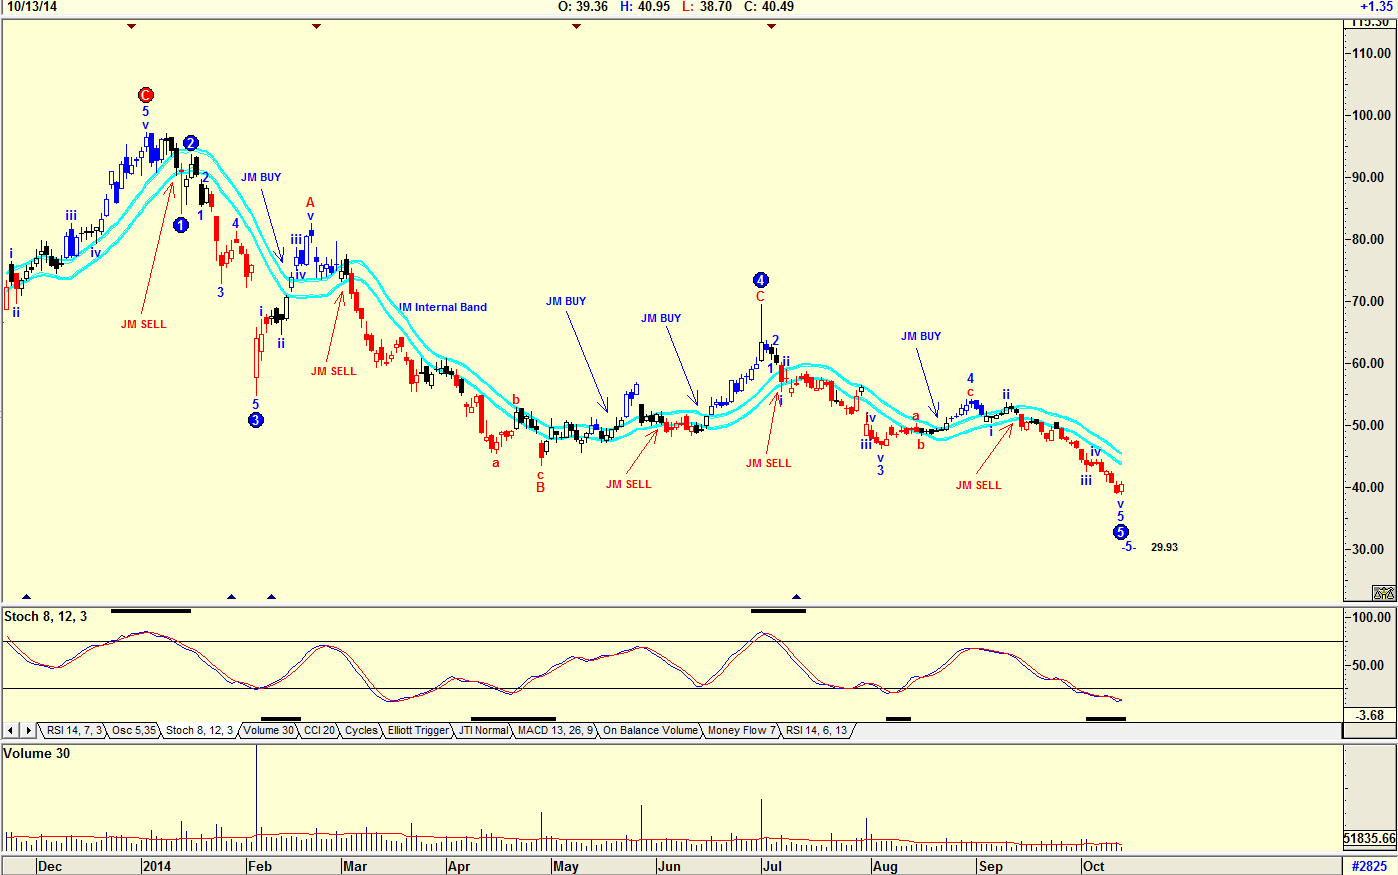
| Figure 1. Elliott Waves. Here you see the daily chart of 3D Systems Corp. (DDD) with Elliott Wave counts overlaid on the price chart. |
| Graphic provided by: AdvancedGET. |
| |
| The chart in Figure 1 is a daily chart of DDD with an Elliott Wave count suggesting that a WAVE 5 down could be complete. The chart is, however, suggesting that the target for the WAVE 5 could be $29.93 but with the relative strength index (RSI) at oversold levels and starting to move toward the 30 horizontal line to suggest a buy, this does seem unlikely. The JM Internal Band indicator, a 15-period simple moving average offset by 2% positive and 2% negative has not given a buy signal and is still negative. A buy signal is given when the share price breaks above the upper band with a sell signal given when the share price moves below the lower band. This indicator tends to be used by more conservative investors. |
|
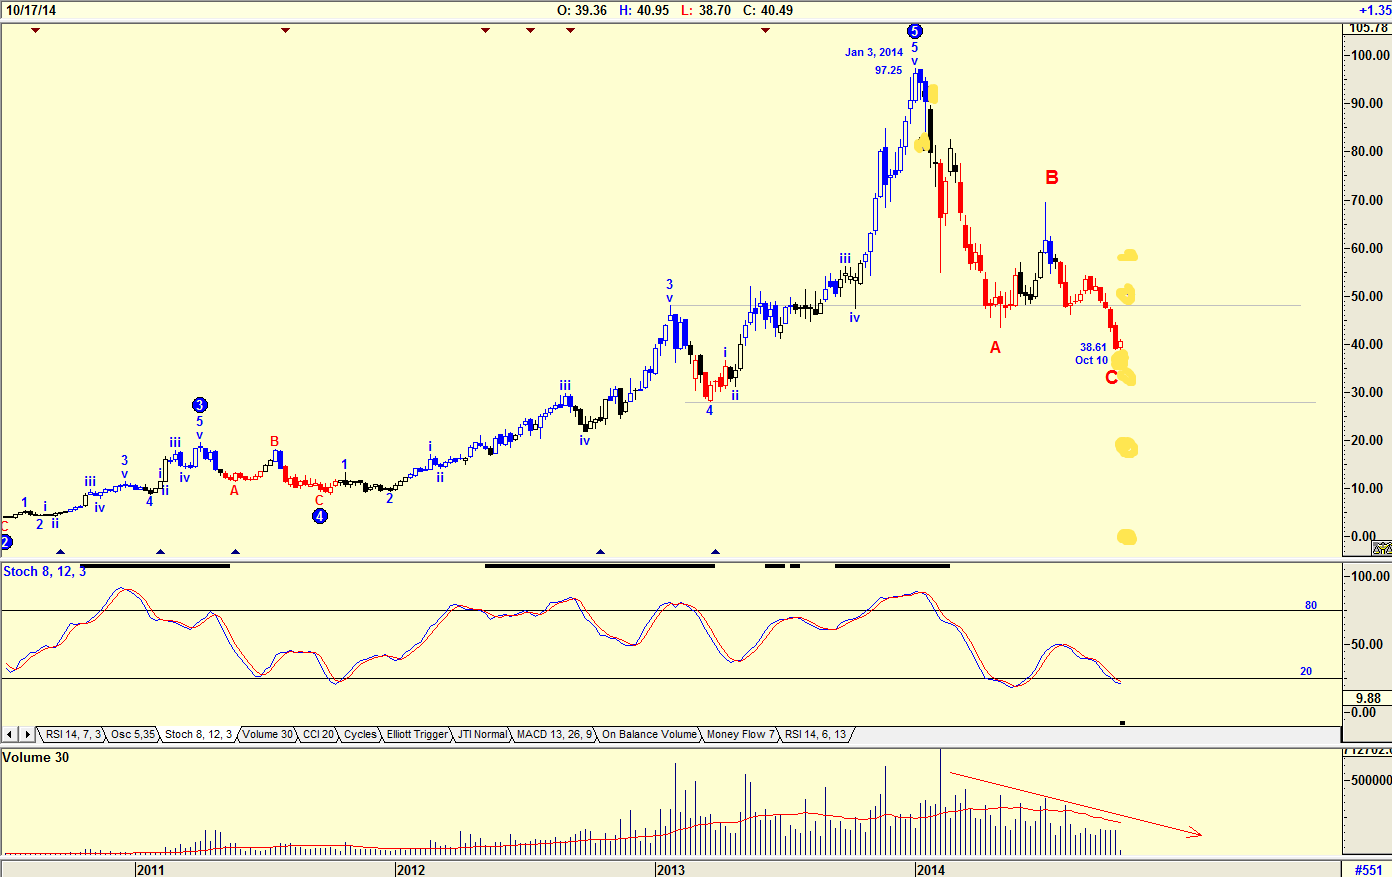
| Figure 2. Weekly Chart. This chart suggests a WAVE 5 high of $97.25 on January 3, 2014. |
| Graphic provided by: AdvancedGET. |
| |
| The chart in Figure 2 is a weekly chart of DDD. The chart suggests a WAVE 5 high of $97.25 on January 3, 2014. The share price has since fallen in an ABC correction to $38.61 by October 10, 2014. Do note the following — the suggested WAVE C bottom is within the 4th Wave of lesser degree and the share could start rising in a new 5 WAVE bull trend. The stochastic indicator is below the 20 horizontal line and could soon start turning up suggesting a buy. Volume has been falling as the share price fell suggesting strength. A falling share price plus rising volume suggests weakness in the share price. A falling share price plus falling volume suggests strength. Rumor is as rumor does. Will Meg Whitman, the Chairman, President, and CEO of Hewlett-Packard encourage HP Inc. to purchase 3-D Systems? Time will tell, but the rumor is not something that can be ignored, and when it becomes more concrete, covering short sales could see the share once again test the $90 level. Based on the rumor, the share is definitely worth a nibble. |
Has been a technical analyst since 1969, and has worked as a futures and options trader with First Financial Futures in Johannesburg, South Africa.
| Address: | 3256 West 24th Ave |
| Vancouver, BC | |
| Phone # for sales: | 6042634214 |
| E-mail address: | petroosp@gmail.com |
Click here for more information about our publications!
PRINT THIS ARTICLE

Request Information From Our Sponsors
- StockCharts.com, Inc.
- Candle Patterns
- Candlestick Charting Explained
- Intermarket Technical Analysis
- John Murphy on Chart Analysis
- John Murphy's Chart Pattern Recognition
- John Murphy's Market Message
- MurphyExplainsMarketAnalysis-Intermarket Analysis
- MurphyExplainsMarketAnalysis-Visual Analysis
- StockCharts.com
- Technical Analysis of the Financial Markets
- The Visual Investor
- VectorVest, Inc.
- Executive Premier Workshop
- One-Day Options Course
- OptionsPro
- Retirement Income Workshop
- Sure-Fire Trading Systems (VectorVest, Inc.)
- Trading as a Business Workshop
- VectorVest 7 EOD
- VectorVest 7 RealTime/IntraDay
- VectorVest AutoTester
- VectorVest Educational Services
- VectorVest OnLine
- VectorVest Options Analyzer
- VectorVest ProGraphics v6.0
- VectorVest ProTrader 7
- VectorVest RealTime Derby Tool
- VectorVest Simulator
- VectorVest Variator
- VectorVest Watchdog