

HOT TOPICS LIST
- MACD
- Fibonacci
- RSI
- Gann
- ADXR
- Stochastics
- Volume
- Triangles
- Futures
- Cycles
- Volatility
- ZIGZAG
- MESA
- Retracement
- Aroon
INDICATORS LIST
LIST OF TOPICS
PRINT THIS ARTICLE
by Donald W. Pendergast, Jr.
When an Elliott Wave and Keltner channel pattern agree that a pullback is likely, it pays to take note.
Position: N/A
Donald W. Pendergast, Jr.
Freelance financial markets writer and online publisher of the Trendzetterz.com S&P 500 Weekly Forecast service.
PRINT THIS ARTICLE
ELLIOTT WAVE
KO: Pullback Due - But How Far?
10/14/14 05:04:24 PMby Donald W. Pendergast, Jr.
When an Elliott Wave and Keltner channel pattern agree that a pullback is likely, it pays to take note.
Position: N/A
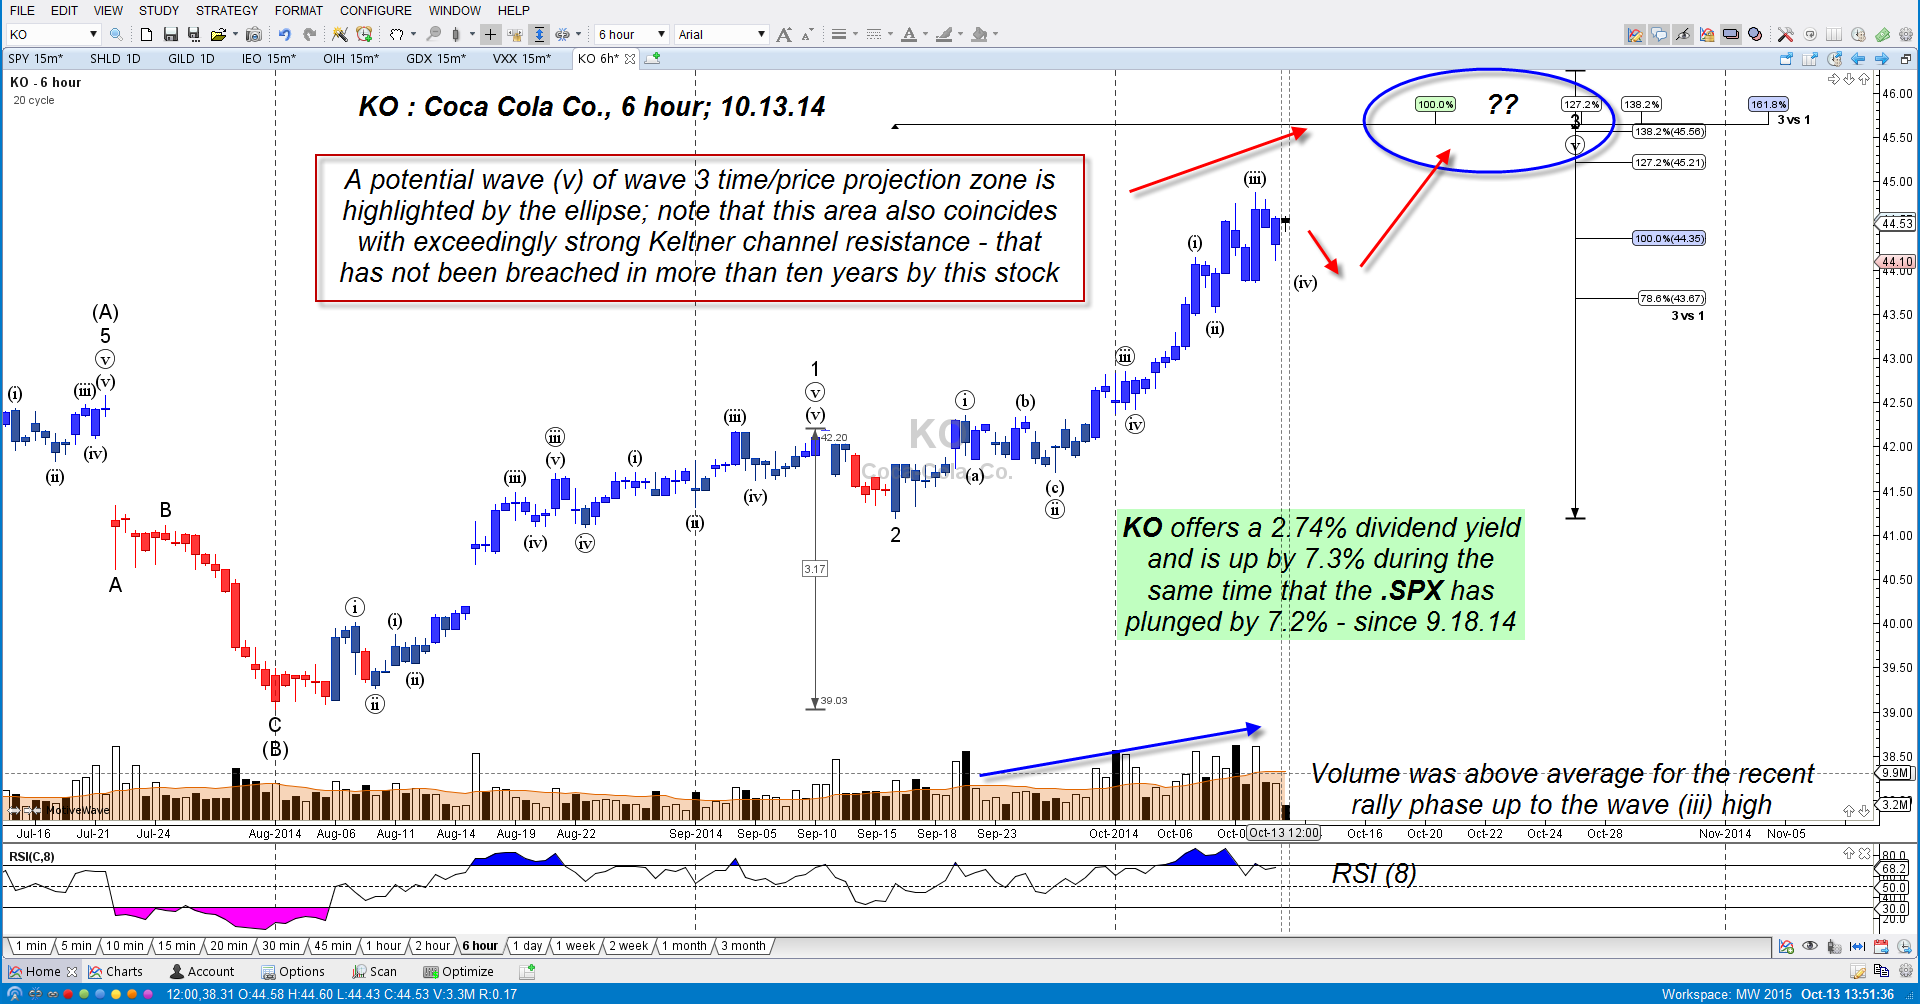
| Shares of Coca Cola Co. (KO) have enjoyed a steady, albeit modest rally since coming out of a significant cycle low on August 1, 2014; the stock has traced out a nice Elliott Wave pattern that sees it in a bullish wave (iv) of 3 wave impulse that has so far managed to see a 15% gain from its early August 2014 inception at 39.03. Even better for the bulls, the current wave three high is projected to terminate at the end of October 2014 somewhere around 45.00/46.00; however, the recent wave (iii) of 3 high also coincided with significant Keltner channel resistance, thus setting the stage for a deeper decline on the current wave (iv) pullback. Here's a closer look now. |
|
| Figure 1. Defensive Stock. Coca Cola Co. (KO) has truly lived up to its reputation as a defensive issue since the S&P 500 (.SPX) began plunging on September 18, 2014; the stock is up 7.3% while the .SPX is off by -7.2% in the last 3 1/2 weeks. |
| Graphic provided by: MotiveWave.com. |
| |
| KO is usually thought of as a defensive stock, one that can weather a bear market beating in much better shape than stocks from industry groups with major shifts in earnings growth and sale rates, and thus far — since the bear began rattling the cage of the S&P 500 index (.SPX, SPY) several weeks ago — KO is up by 7.3% since the .SPX peaked at 201.80 on September 18, 2014 before tumbling by 7.2% as of October 13, 2014 (Figure 1)! Talk about a perfectly inverse correlation, indeed — this should make it clear to longer term investors (and even swing traders) that having a diversified, non-correlated portfolio is still one of the best ways to guard against major drawdowns in your brokerage account. KO is having a minor downdraft from its wave (iii) high, but is now pulling down into what should be a simple wave (iv) low, after which a possible wave 5 run higher becomes the line of least resistance. On KO's six-hour chart you find the semi-automated ratio/time projections for wave 3 vs. wave 1; the lower price projection for wave 3 has already been hit (at least 100% of wave 1) but has not yet met the ideal time projections, now projected as follows: 100% of wave 1 = October 20, 2014 127.2% of wave 1 = October 27, 2014 161.8% of wave 1 = November 3, 2014 Ellioticians usually put more weight of price projections than time projections for wave counts, but it's still useful to know where such potential termination zones are — ahead of time. When time/price projections do coincide, there can be especially powerful moves in a given stock, forex, or futures market. The big idea here is to watch for a wave (iv) pullback toward 44.00, followed by a strong snap higher. If you see this and the wave (iii) high at 44.87 is taken out soon afterward, the run toward the wave 3 ultimate high north of 45.50/46.00 may be underway. |
|
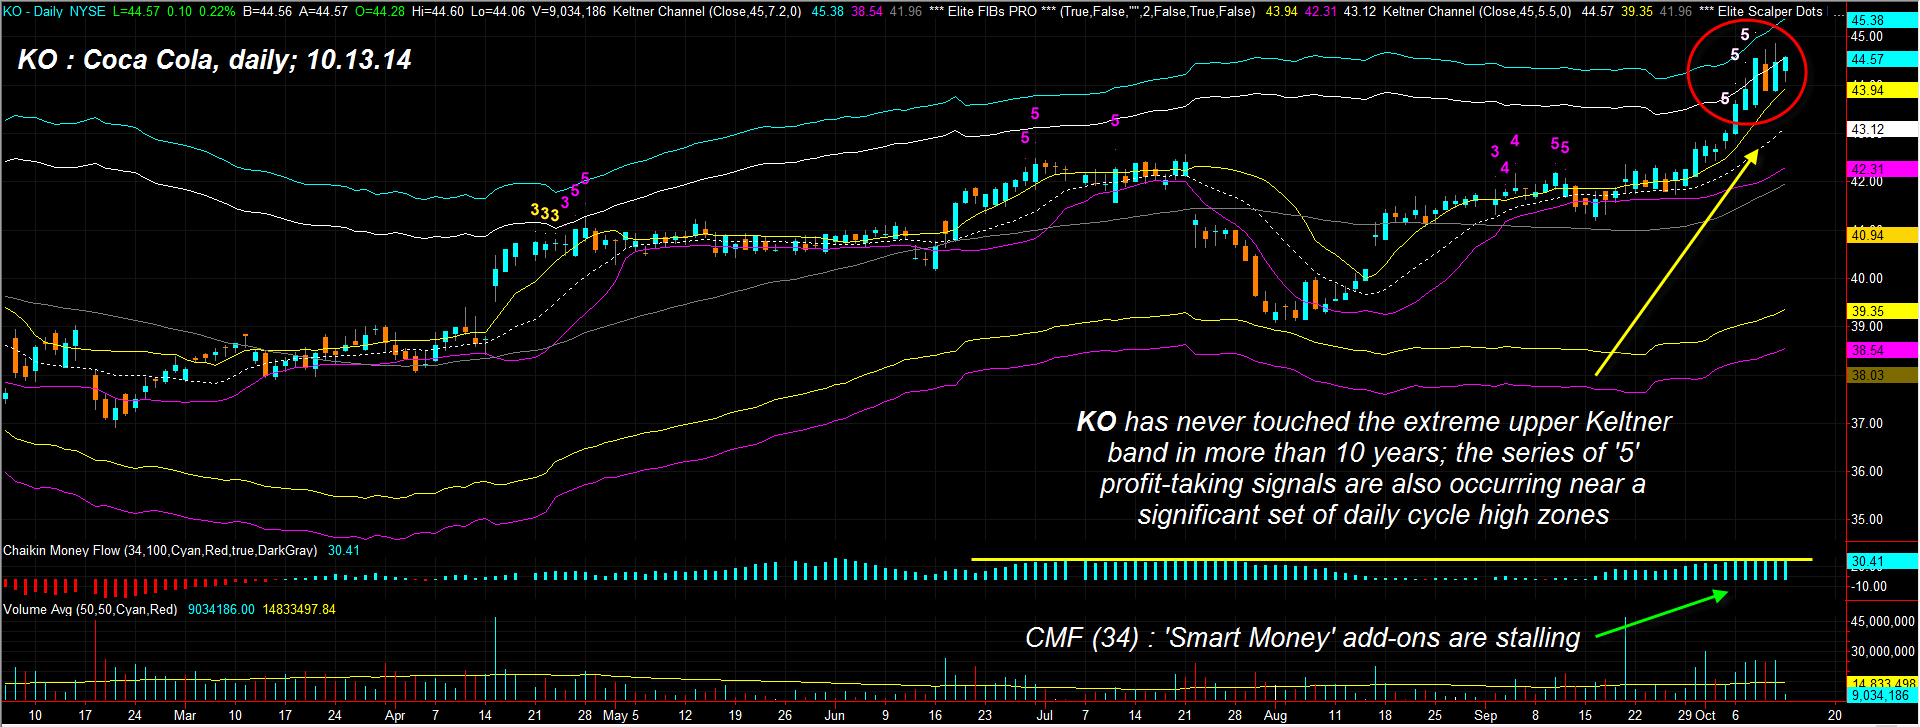
| Figure 2. Keltner Channels. KO is near a very powerful Keltner channel resistance zone, one that has not been breached by the stock in more than ten years. |
| Graphic provided by: TradeStation. |
| Graphic provided by: Elite Trader Indicators by Fibozachi.com. |
| |
| As useful as the Elliott Wave analysis truly is, you also need to be aware of these Keltner channel dynamics on KO's daily chart (Figure 2): 1. This stock has never once touched its extreme upper Keltner channel in the last 10 years. 2. The series of '5' profit taking signals near the upper set of bands is another warning sign that most, if not all, of the August-October rally has already been achieved. 3. The 34-day Chaikin Money Flow's (CMF)(34) latest histogram peak is essentially flat with the one seen in July 2014 and is another sign that the rally needs a correction before being able to muster that next 3rd wave high in late October 2014/early November 2014. Given its proven defensive nature, KO can still be considered a buy once the wave (iv) is in place and it begins to resume its upward trend; however, be aware that any strong surge higher will almost certainly be capped by the extreme upper band (currently near 45.38). Be quick to take profits if you are swing trading this combined wave (v)/wave 3 rally heading into November 2014 and KO makes it back up into the lower to mid 45.00 area. Trade wisely until we meet here again. |
Freelance financial markets writer and online publisher of the Trendzetterz.com S&P 500 Weekly Forecast service.
| Title: | Market consultant and writer |
| Company: | Trendzetterz |
| Address: | 81 Hickory Hollow Drive |
| Crossville, TN 38555 | |
| Phone # for sales: | 904-303-4814 |
| Website: | trendzetterz.com |
| E-mail address: | support@trendzetterz.com |
Traders' Resource Links | |
| Trendzetterz has not added any product or service information to TRADERS' RESOURCE. | |
Click here for more information about our publications!
PRINT THIS ARTICLE

Request Information From Our Sponsors
- StockCharts.com, Inc.
- Candle Patterns
- Candlestick Charting Explained
- Intermarket Technical Analysis
- John Murphy on Chart Analysis
- John Murphy's Chart Pattern Recognition
- John Murphy's Market Message
- MurphyExplainsMarketAnalysis-Intermarket Analysis
- MurphyExplainsMarketAnalysis-Visual Analysis
- StockCharts.com
- Technical Analysis of the Financial Markets
- The Visual Investor
- VectorVest, Inc.
- Executive Premier Workshop
- One-Day Options Course
- OptionsPro
- Retirement Income Workshop
- Sure-Fire Trading Systems (VectorVest, Inc.)
- Trading as a Business Workshop
- VectorVest 7 EOD
- VectorVest 7 RealTime/IntraDay
- VectorVest AutoTester
- VectorVest Educational Services
- VectorVest OnLine
- VectorVest Options Analyzer
- VectorVest ProGraphics v6.0
- VectorVest ProTrader 7
- VectorVest RealTime Derby Tool
- VectorVest Simulator
- VectorVest Variator
- VectorVest Watchdog