

HOT TOPICS LIST
- MACD
- Fibonacci
- RSI
- Gann
- ADXR
- Stochastics
- Volume
- Triangles
- Futures
- Cycles
- Volatility
- ZIGZAG
- MESA
- Retracement
- Aroon
INDICATORS LIST
LIST OF TOPICS
PRINT THIS ARTICLE
by Matt Blackman
The beginning of October 2014 was a tough one for traders and investors. So what happens next?
Position: N/A
Matt Blackman
Matt Blackman is a full-time technical and financial writer and trader. He produces corporate and financial newsletters, and assists clients in getting published in the mainstream media. He is the host of TradeSystemGuru.com. Matt has earned the Chartered Market Technician (CMT) designation. Find out what stocks and futures Matt is watching on Twitter at www.twitter.com/RatioTrade
PRINT THIS ARTICLE
HEAD & SHOULDERS
Plumbing For A Bottom In Stocks
10/10/14 04:33:00 PMby Matt Blackman
The beginning of October 2014 was a tough one for traders and investors. So what happens next?
Position: N/A
| In four out of the first six trading days of October 2014 the Dow Jones Industrial Average (DJIA) experienced daily moves of more than 200 points. The end result of all that emotional and financial angst was that by market close on October 8, 2014 the index was down just 0.27% in six days causing many bulls to try and buy the dip. As it turned out, bears used the one-day rally to get short and stocks dropped like a stone on October 9, 2014. |
|
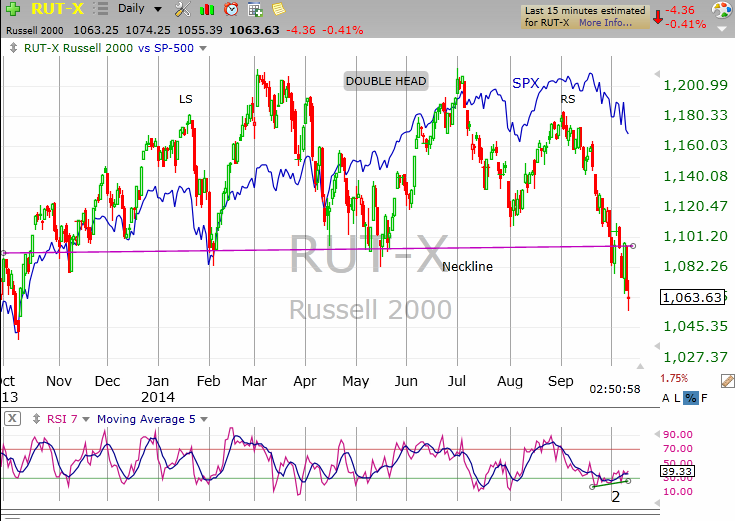
| Figure 1. Bearish H&S. On this daily chart you see a bearish head & shoulders pattern that formed the Russell 2000 (RUT-X) index over the previous year. |
| Graphic provided by: TC2000.com. |
| |
| The Russell 2000 index is made up of US small cap stocks that have had a habit of leading large cap stocks in rallies and corrections. In a recovery, small cap stocks tend to be more reactive to the positive economic environment and post larger gains. But they also tend to suffer first when contagion hits. As you can see in Figure 1, the RUT-X spent the last year posting a bearish head & shoulders (H&S) pattern with a neckline around 1095. On October 1, 2014 the index breached the H&S neckline, surged back above it two days later before plunging back down below it again October 7, 2014. As it turns out the breach of the neckline on October 8, 2014 (thanks in large part of some encouraging comments on interest rates from the Fed) was a sucker's rally. In the process, it put in a bullish engulfing candlestick pattern which was accompanied by bullish convergence by the seven-day relative strength index or RSI (Figure 2) — a tempting buy signal indeed! But the next day, the index fell back through the neckline like a hot (falling) knife through butter. |
|
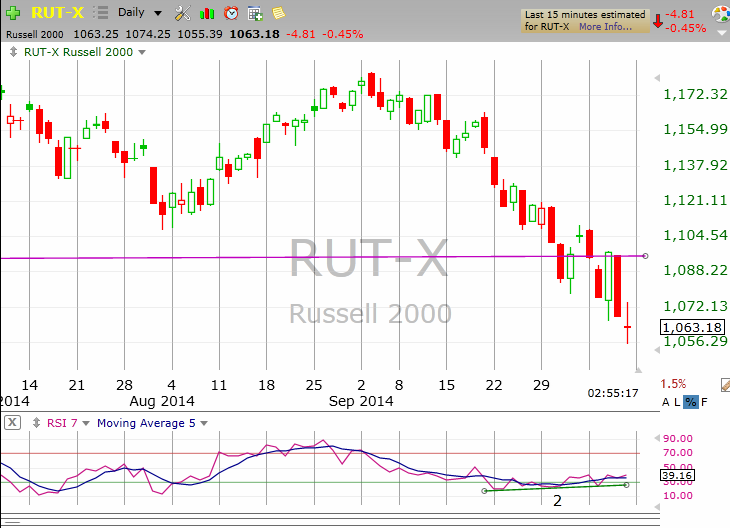
| Figure 2. Bullish patterns? Here you see a shorter term chart of RUT-X highlighting the bullish engulfing pattern on October 8, 2014 and bullish RSI. The red doji pattern on October 10, 2014 could indicate a change in sentiment but it's too early to be sure. |
| Graphic provided by: TC2000.com. |
| |
| So what is the implication for stock markets? A recovery, when it comes for the Russell 2000 rally would be bullish for the rest of the market given the previous history of this index. And given the highly oversold nature of the market, another one or two day rally is due. |
| Another factor could also bode well for the market. The percentage of stocks trading above their 200-day moving averages (T2107) had also hit a reading of 33.4% on October 10, 2014 a level not seen since December 2011 after which the S&P 500 rallied strongly. |
| Before I put my bullish hat on, I will need to see T2107 positively diverge with the S&P 500 as the divergence with the major indexes would show building strength in market breadth as well as a bottom in the RSI for the Russell. We are at levels in the percentage of stocks trading above their 50- and 200-day moving averages from which markets have rallied strongly. But we need to see solid evidence of this; going long without a good technical reason is like rolling dice at the craps table. |
Matt Blackman is a full-time technical and financial writer and trader. He produces corporate and financial newsletters, and assists clients in getting published in the mainstream media. He is the host of TradeSystemGuru.com. Matt has earned the Chartered Market Technician (CMT) designation. Find out what stocks and futures Matt is watching on Twitter at www.twitter.com/RatioTrade
| Company: | TradeSystemGuru.com |
| Address: | Box 2589 |
| Garibaldi Highlands, BC Canada | |
| Phone # for sales: | 604-898-9069 |
| Fax: | 604-898-9069 |
| Website: | www.tradesystemguru.com |
| E-mail address: | indextradermb@gmail.com |
Traders' Resource Links | |
| TradeSystemGuru.com has not added any product or service information to TRADERS' RESOURCE. | |
Click here for more information about our publications!
Comments
Date:�10/16/14Rank:�5Comment:�

Request Information From Our Sponsors
- VectorVest, Inc.
- Executive Premier Workshop
- One-Day Options Course
- OptionsPro
- Retirement Income Workshop
- Sure-Fire Trading Systems (VectorVest, Inc.)
- Trading as a Business Workshop
- VectorVest 7 EOD
- VectorVest 7 RealTime/IntraDay
- VectorVest AutoTester
- VectorVest Educational Services
- VectorVest OnLine
- VectorVest Options Analyzer
- VectorVest ProGraphics v6.0
- VectorVest ProTrader 7
- VectorVest RealTime Derby Tool
- VectorVest Simulator
- VectorVest Variator
- VectorVest Watchdog
- StockCharts.com, Inc.
- Candle Patterns
- Candlestick Charting Explained
- Intermarket Technical Analysis
- John Murphy on Chart Analysis
- John Murphy's Chart Pattern Recognition
- John Murphy's Market Message
- MurphyExplainsMarketAnalysis-Intermarket Analysis
- MurphyExplainsMarketAnalysis-Visual Analysis
- StockCharts.com
- Technical Analysis of the Financial Markets
- The Visual Investor