HOT TOPICS LIST
- MACD
- Fibonacci
- RSI
- Gann
- ADXR
- Stochastics
- Volume
- Triangles
- Futures
- Cycles
- Volatility
- ZIGZAG
- MESA
- Retracement
- Aroon
INDICATORS LIST
LIST OF TOPICS
PRINT THIS ARTICLE
by Thomas Bopp
In the last few days, when most stocks were falling, one stock on the Dow Jones Industrial Average (DJIA) showed great performance. Technical analysis tells us that there is room for more upside.
Position: Buy
Thomas Bopp
Thomas Bopp has more than 25 years experience in all kinds of trading. He mainly trades options on the short-side based on his own unique trading systems. He is also responsible for a German and Spanish free daily market newsletter, which covers the S&P 500, Ibex 35, DAX and German Bund-Future.
PRINT THIS ARTICLE
SEASONAL TRADING
Coca Cola Should Be On Your Buy List
10/10/14 04:21:12 PMby Thomas Bopp
In the last few days, when most stocks were falling, one stock on the Dow Jones Industrial Average (DJIA) showed great performance. Technical analysis tells us that there is room for more upside.
Position: Buy
| If things get crazy in the stock markets, investors rely on dividend-income. A high-yield payout is often a good reason to hold on to a stock for the long-term, which may be the reason the stock of Coca-Cola Co (KO) is a favorite. The stock has paid a dividend steadily for 52 years and annual dividend growth for 10 years has been 9.8%. |

|
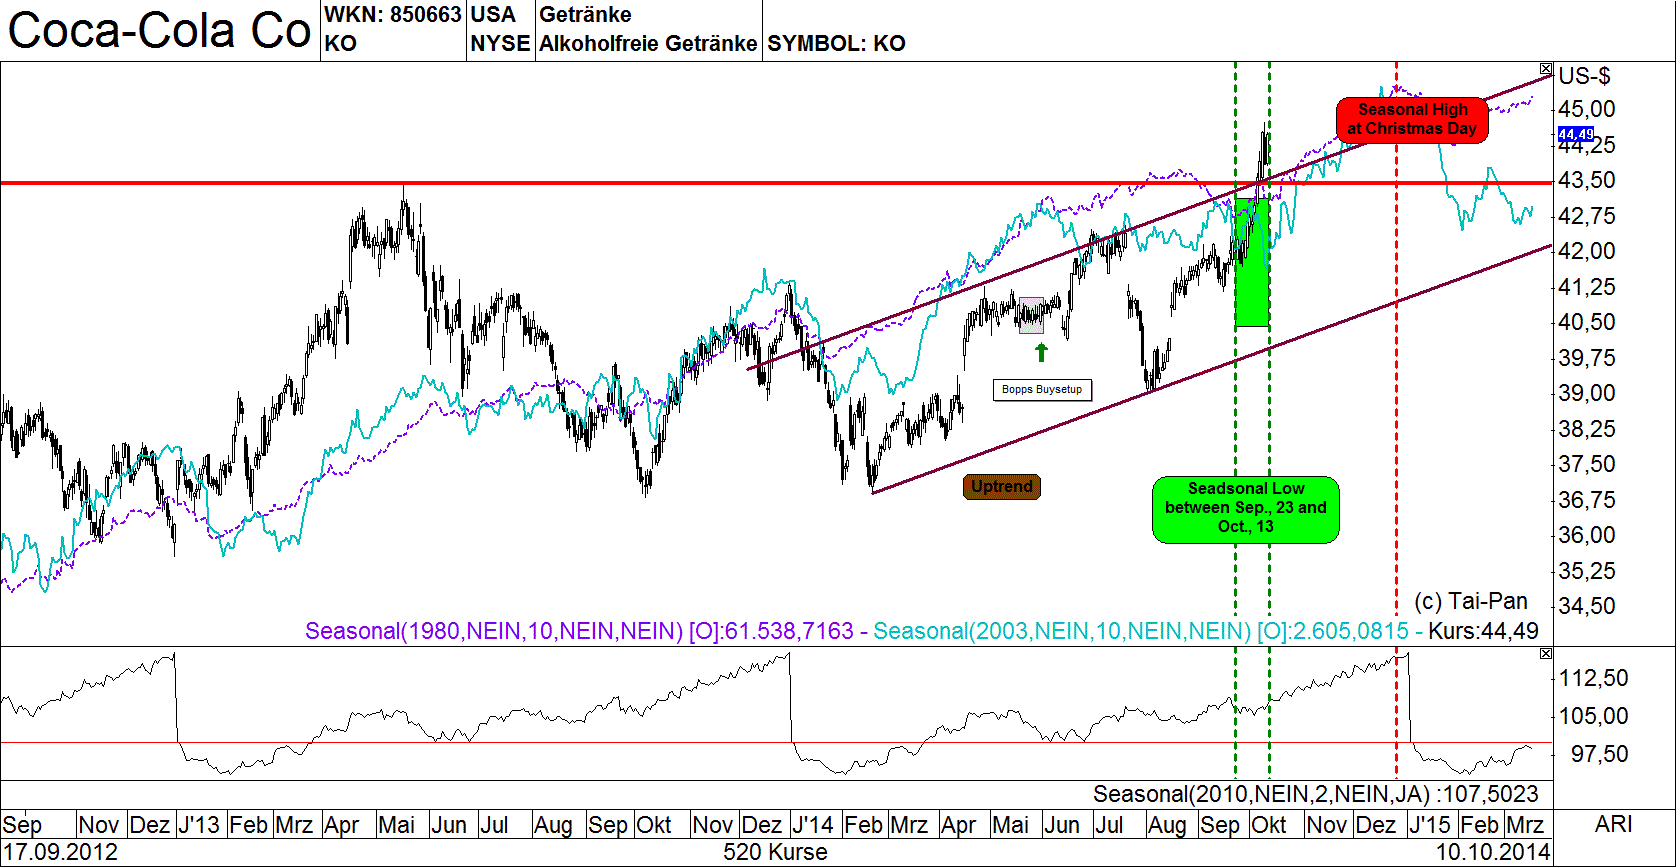
| Figure 1. Upward Trend. A good entry for Coca-Cola (KO) can be seen at the seasonal low. The breakout is a buy signal that has the potential to move up to the seasonal high expected on December 24, 2014. |
| Graphic provided by: www.lp-software.de. |
| |
| Figure 1 shows KO in an upward mode. It rose above a long-term resistance at $43.50, breaking the upper trend-channel resistance. What is interesting is that the move starts at an area for a seasonal low as showed by the two seasonal lines. Although the stock has time until October 13, 2014 to make a bottom, it has started climbing. The move, therefore, is a long-term buy signal with a seasonal high on December, 24, 2014, and the breakout could be good for an additional 10% or more. |

|
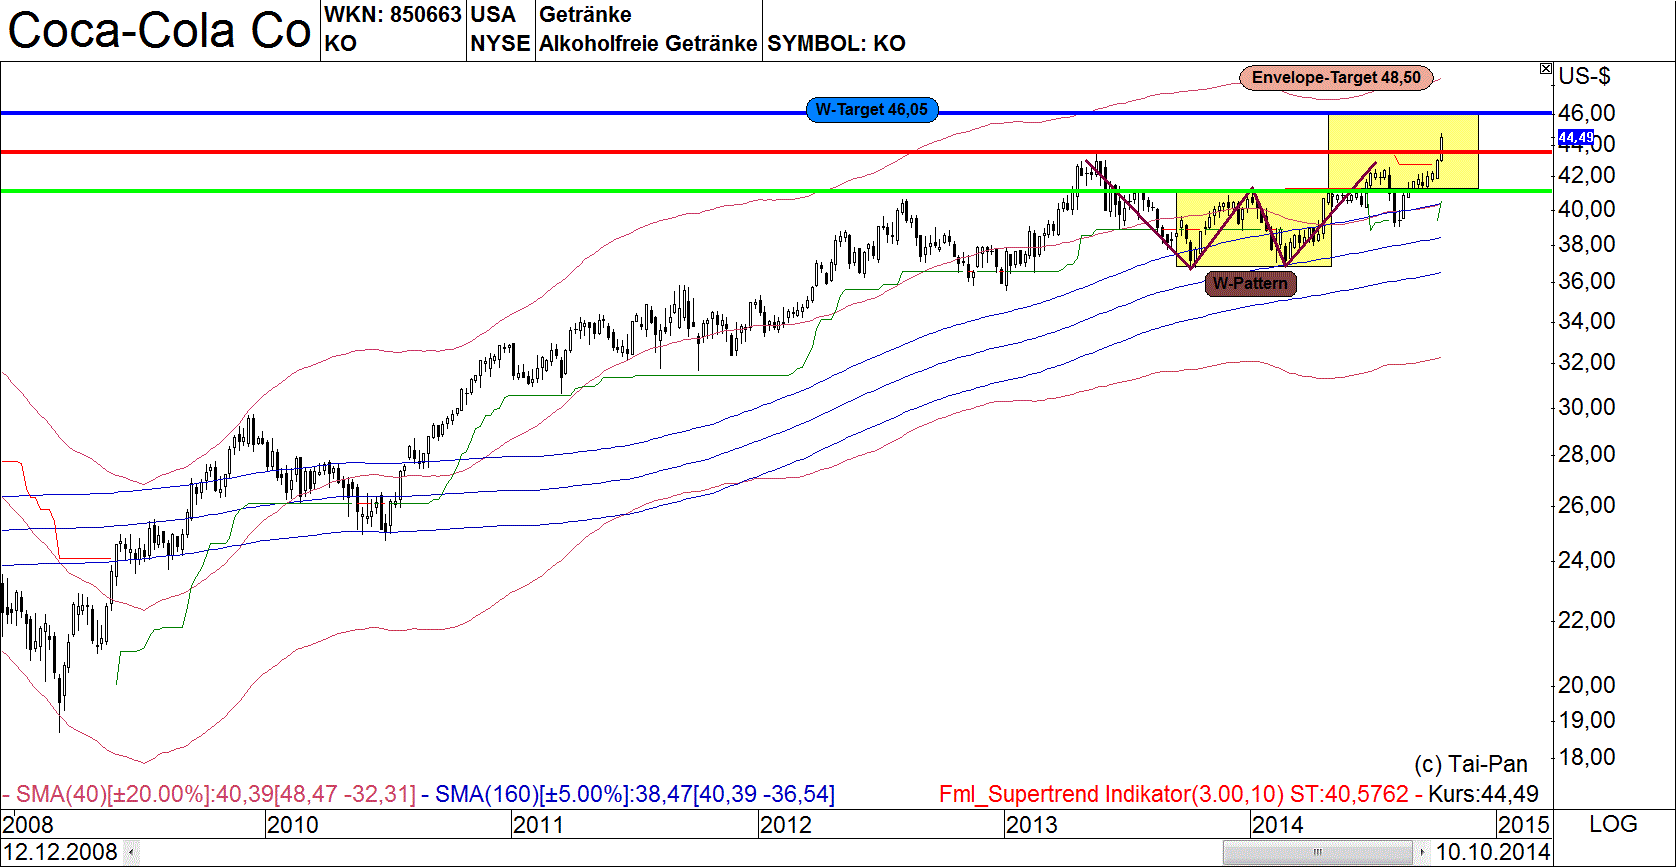
| Figure 2. Envelope Chart. A minimum target used with the trading range of the W-formation comes in at $46.05, while the upper 200-day envelope suggests that $48.50 could be possible. |
| Graphic provided by: www.lp-software.de. |
| |
| Figure 2 shows an envelope chart, with the first target at $46.05. I mirrored the former trading range from the W-formation to the upside to get the minimum target. The second goal is the upper 200-day envelope with a deviation of 20%, which right now is calculated at $48.50. If you have a long position in the stock, you should place a stop-loss at $42. |

|
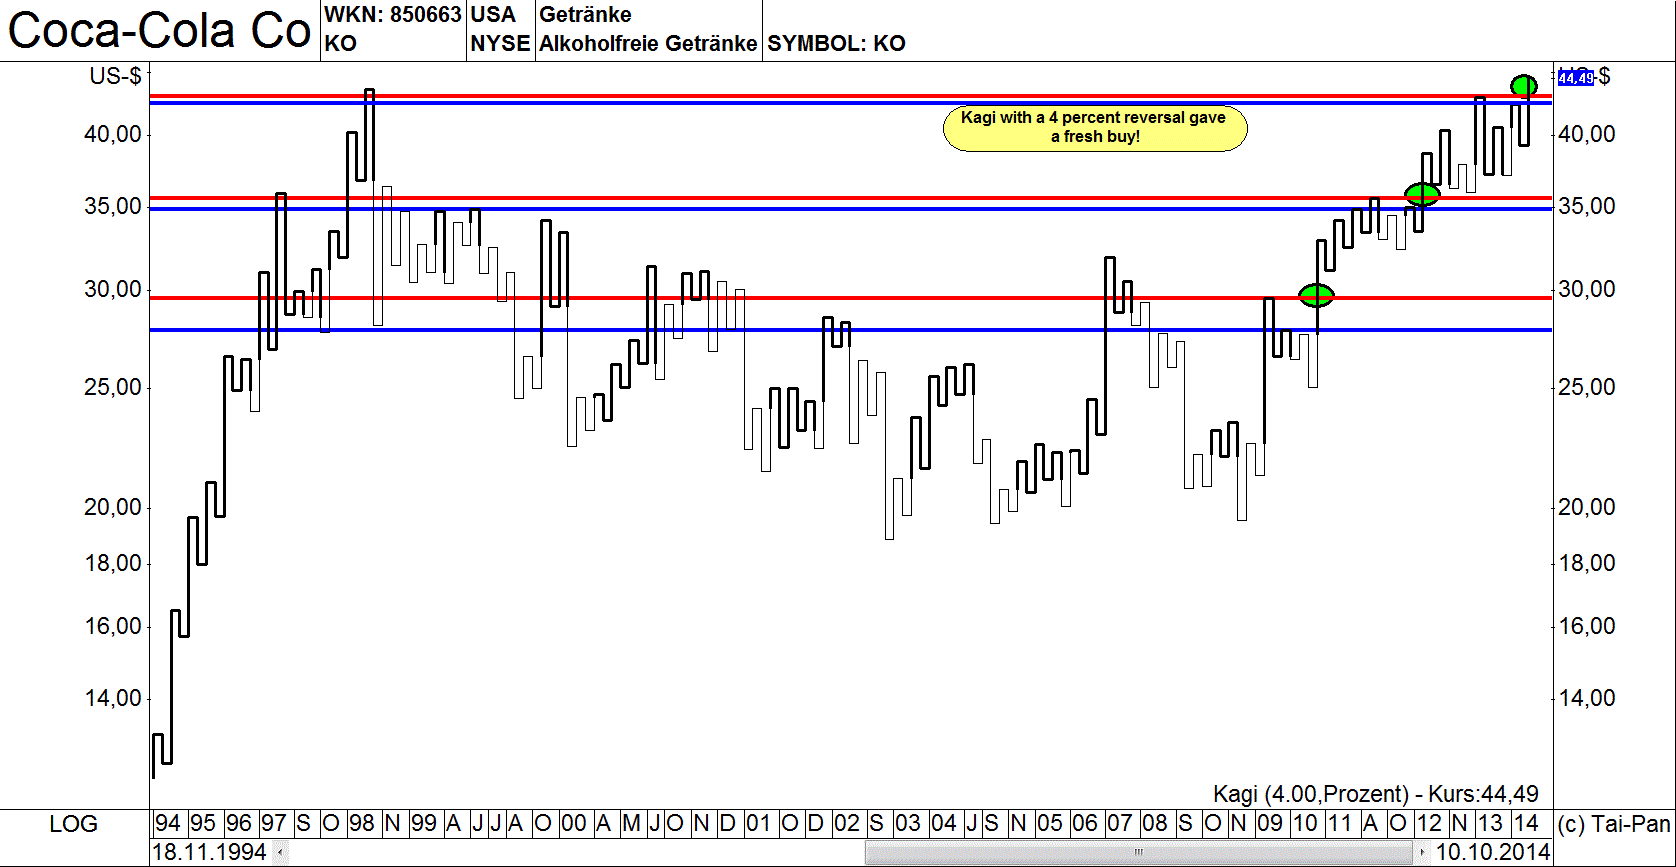
| Figure 3. Kagi-Chart. |
| Graphic provided by: www.lp-software.de. |
| |
| I would like to show you another chart of KO. It is a kagi chart, which is similar to a point & figure chart. There must be a minimum move to get a buy or sell signal. In this case it has to be more than 4%. Breakouts are signals. The reason I presented this chart is to determine how KO moved in the past when a similar upside signal occurred. As a technical analyst, I analyze every chart extensively and I have found that each time a preceding high was exceeded, the upcoming move would be a strong one. The blue line shows the current buy signal while the red line shows where the former high was crossed. Every time when that occurred, a movement of more than 10% occurred in the following months. If the stock moves similarly to these previous upside signals, a 10% upside potential is likely to be achieved soon. |
Thomas Bopp has more than 25 years experience in all kinds of trading. He mainly trades options on the short-side based on his own unique trading systems. He is also responsible for a German and Spanish free daily market newsletter, which covers the S&P 500, Ibex 35, DAX and German Bund-Future.
| Title: | Freelance trader and analyst |
| Company: | Bopp's Financial Market Studies |
| Address: | Eichendorffweg 6 |
| 61194 Niddatal, Germany, 61194 | |
| Phone # for sales: | +49 60347961 |
| E-mail address: | webmaster@zyklusanalyst.de |
Traders' Resource Links | |
| Bopp's Financial Market Studies has not added any product or service information to TRADERS' RESOURCE. | |
Click here for more information about our publications!
Comments
Date: 10/12/14Rank: 4Comment:

Request Information From Our Sponsors
- StockCharts.com, Inc.
- Candle Patterns
- Candlestick Charting Explained
- Intermarket Technical Analysis
- John Murphy on Chart Analysis
- John Murphy's Chart Pattern Recognition
- John Murphy's Market Message
- MurphyExplainsMarketAnalysis-Intermarket Analysis
- MurphyExplainsMarketAnalysis-Visual Analysis
- StockCharts.com
- Technical Analysis of the Financial Markets
- The Visual Investor
- VectorVest, Inc.
- Executive Premier Workshop
- One-Day Options Course
- OptionsPro
- Retirement Income Workshop
- Sure-Fire Trading Systems (VectorVest, Inc.)
- Trading as a Business Workshop
- VectorVest 7 EOD
- VectorVest 7 RealTime/IntraDay
- VectorVest AutoTester
- VectorVest Educational Services
- VectorVest OnLine
- VectorVest Options Analyzer
- VectorVest ProGraphics v6.0
- VectorVest ProTrader 7
- VectorVest RealTime Derby Tool
- VectorVest Simulator
- VectorVest Variator
- VectorVest Watchdog
