HOT TOPICS LIST
- MACD
- Fibonacci
- RSI
- Gann
- ADXR
- Stochastics
- Volume
- Triangles
- Futures
- Cycles
- Volatility
- ZIGZAG
- MESA
- Retracement
- Aroon
INDICATORS LIST
LIST OF TOPICS
PRINT THIS ARTICLE
by Gary Grosschadl
Invision is coming off a double top and looks vulnerable if the nearby moving averages fail to hold.
Position: N/A
Gary Grosschadl
Independent Canadian equities trader and technical analyst based in Peterborough
Ontario, Canada.
PRINT THIS ARTICLE
DOUBLE TOPS
Dim View For Invision Technologies
10/28/02 10:24:02 AMby Gary Grosschadl
Invision is coming off a double top and looks vulnerable if the nearby moving averages fail to hold.
Position: N/A
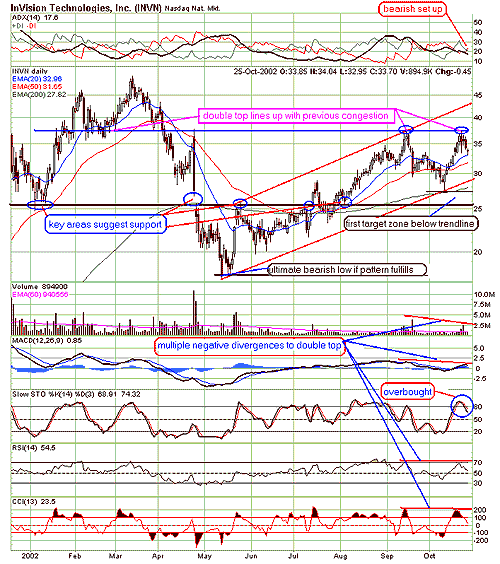
| The daily chart for Invision (INVN) shows multiple negative divergences, giving credibility to a downturn. However if the double top pattern fullfils, there could be a big downleg. This stock has had quite a run since beginning its uptrend via the upward trending channel. It seems to have hit a ceiling as the double top suggests and looking back I see previous congestion. As these patterns unfold, looking back for key areas is often insightful as previous support and resistance still influence future action. This occurs because human nature and behavior have a memory. |
| At the very least, a move to the lower trendline can be expected, but as before the stock may find temporary support at the 20- or 50-day exponential moving averages. |

|
| Graphic provided by: stockcharts.com. |
| |
| Measuring from the top of the double top to the trough in between is approximately 9 points. This gives a bottom target zone below $20. This does not mean it will go that far down but the potential is there. |
| If the lower trendline is violated, I favor the first target zone as marked on the chart. The top black line at about 27.50 lines up nicely with the previous hammer and the bottom of that very bearish candlestick last April. This could offer good support. The next strong support likely kicks in at about $26 where there are several key areas from the past, including two previous gap zones. |
| For this double top to fail with conviction, watch for expanding volume (the greater the better) as it weakens below the bottom channel trendline around $29. A move back up to the trendline to test the pattern is a real possibility and subsequent failure there would be another opportunity for those targeting a short position. Should the overall markets hit more turbulence and challenge new lows once again, stocks exhibiting patterns like this bearish double top can keep traders profitable on the short side. |
Independent Canadian equities trader and technical analyst based in Peterborough
Ontario, Canada.
| Website: | www.whatsonsale.ca/financial.html |
| E-mail address: | gwg7@sympatico.ca |
Click here for more information about our publications!
Comments
Date: 10/29/02Rank: 3Comment:

Request Information From Our Sponsors
- StockCharts.com, Inc.
- Candle Patterns
- Candlestick Charting Explained
- Intermarket Technical Analysis
- John Murphy on Chart Analysis
- John Murphy's Chart Pattern Recognition
- John Murphy's Market Message
- MurphyExplainsMarketAnalysis-Intermarket Analysis
- MurphyExplainsMarketAnalysis-Visual Analysis
- StockCharts.com
- Technical Analysis of the Financial Markets
- The Visual Investor
- VectorVest, Inc.
- Executive Premier Workshop
- One-Day Options Course
- OptionsPro
- Retirement Income Workshop
- Sure-Fire Trading Systems (VectorVest, Inc.)
- Trading as a Business Workshop
- VectorVest 7 EOD
- VectorVest 7 RealTime/IntraDay
- VectorVest AutoTester
- VectorVest Educational Services
- VectorVest OnLine
- VectorVest Options Analyzer
- VectorVest ProGraphics v6.0
- VectorVest ProTrader 7
- VectorVest RealTime Derby Tool
- VectorVest Simulator
- VectorVest Variator
- VectorVest Watchdog
