

HOT TOPICS LIST
- MACD
- Fibonacci
- RSI
- Gann
- ADXR
- Stochastics
- Volume
- Triangles
- Futures
- Cycles
- Volatility
- ZIGZAG
- MESA
- Retracement
- Aroon
INDICATORS LIST
LIST OF TOPICS
PRINT THIS ARTICLE
by Donald W. Pendergast, Jr.
Down by 25% from its July 2014 highs, shares of Ford Motor (F) are very close to a bullish reversal zone.
Position: N/A
Donald W. Pendergast, Jr.
Freelance financial markets writer and online publisher of the Trendzetterz.com S&P 500 Weekly Forecast service.
PRINT THIS ARTICLE
ELLIOTT WAVE
Ford Motor: Exhaustion/Reversal Zone
10/10/14 04:14:05 PMby Donald W. Pendergast, Jr.
Down by 25% from its July 2014 highs, shares of Ford Motor (F) are very close to a bullish reversal zone.
Position: N/A
| Whenever a widely followed, large cap, all-American brand-name large cap stock goes over the proverbial cliff, succumbing to a powerful 3rd wave decline, the selling pressure can get intense; such has been the situation in shares of Ford Motor (F) since mid-summer 2014, with the stock still in a strong wave three selloff. However, numerous leading technicals agree that a bullish turn is due very soon. Here's a closer look now. |
|
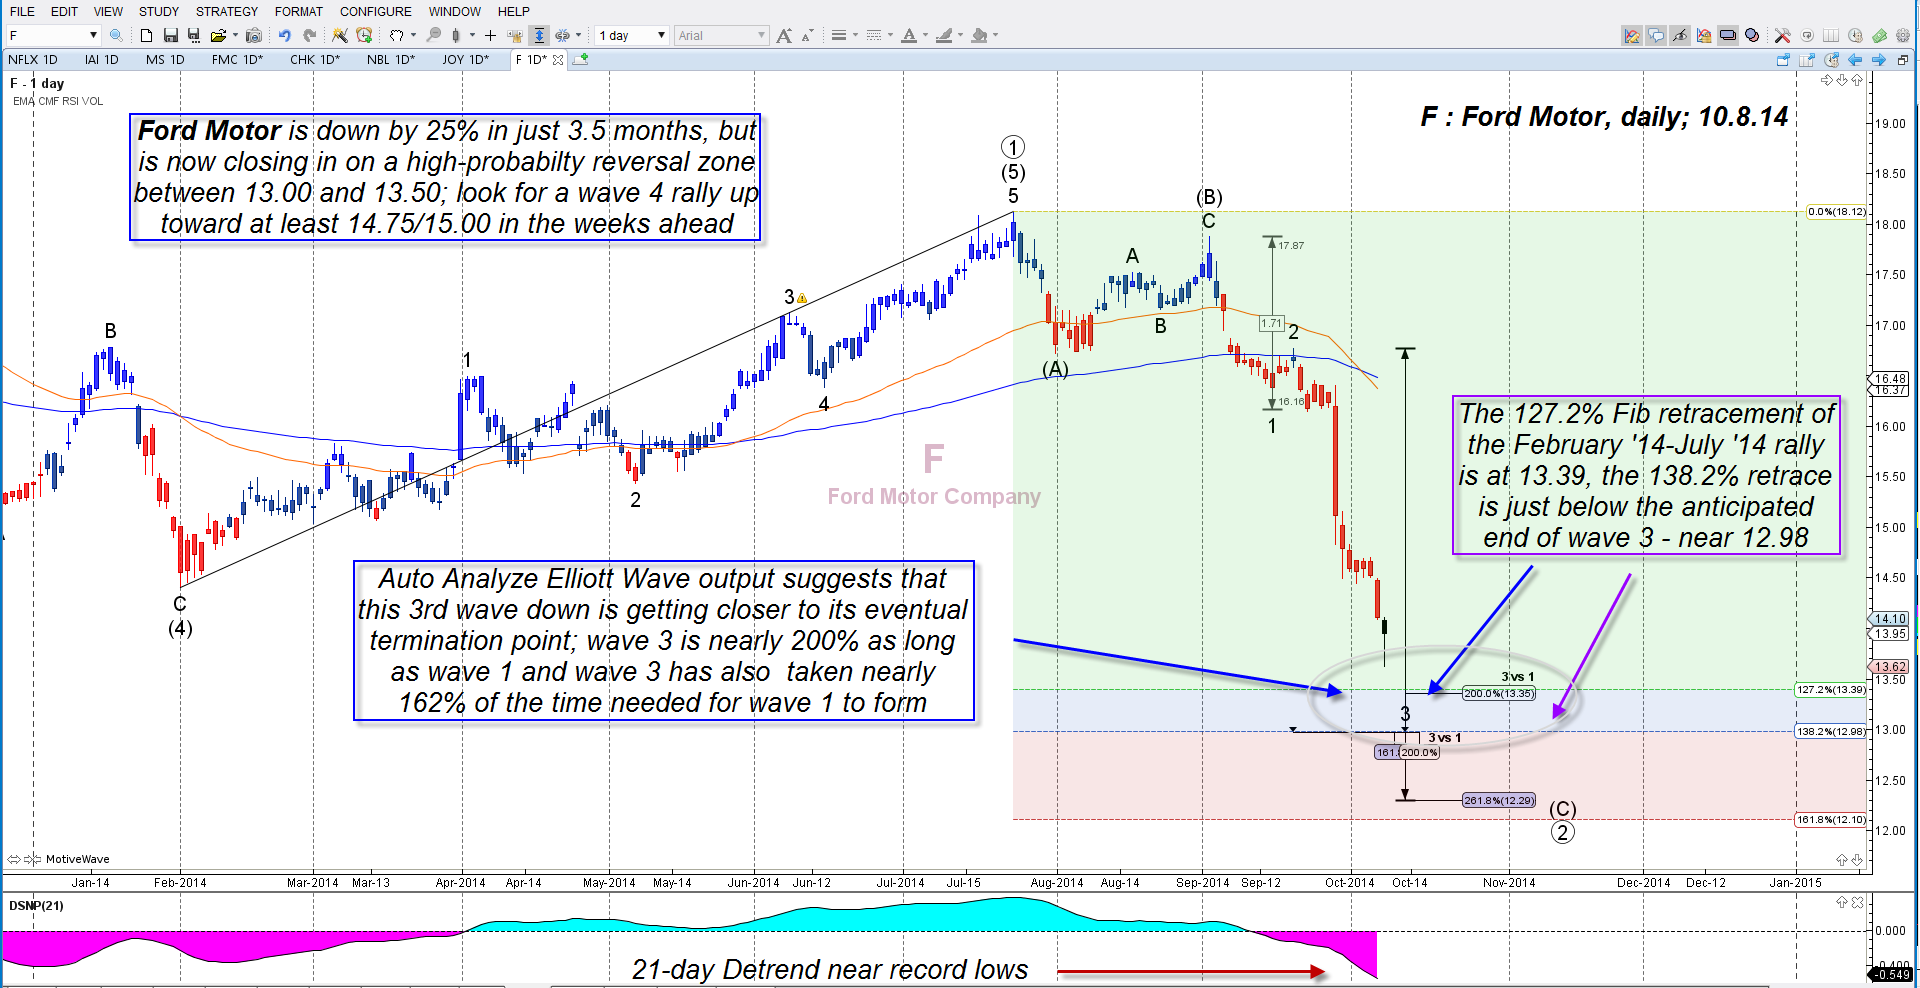
| Figure 1. Waves in Ford Motor (F): The ellipse area near 13.00/13.50 highlights a high probability bullish reversal zone for this stock. Once the turn finally occurs, expect a wave 4 rally to at least 14.75/15.00. |
| Graphic provided by: MotiveWave.com. |
| |
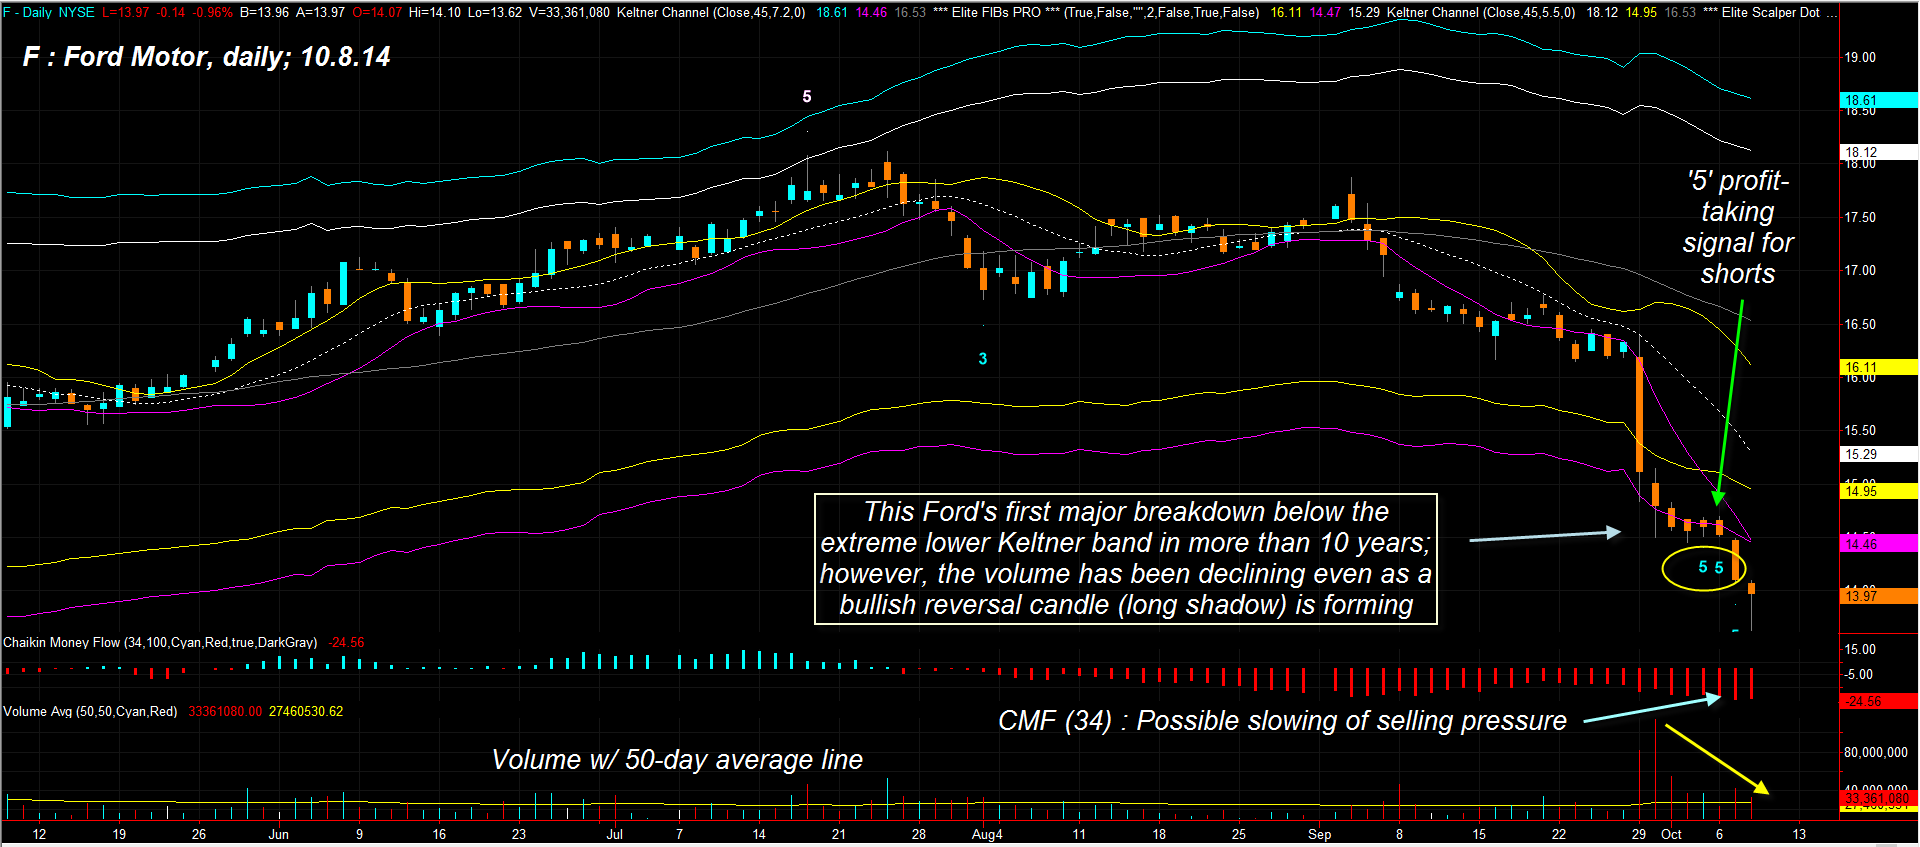
| Down-trending markets typically cover ground at a much faster rate of speed than their up-trending counterparts; for a visual on this, just look at Ford's 5-wave advance from February 2014 to late July 2014 (Figure 1). During this nearly six-month rally, the stock rose by 25.13% before topping at 18.12 on July 24, 2014. Compare that rate of ascent with the 25% decline seen in the 2 1/2 months since the July high was hit — it's more than twice the rate of speed on the downside. Short selling can be profitable, but only if you can find a stock/ETF that is confirming multiple degrees of simultaneous reversal or trend continuation to the downside. That was certainly the case with Ford, and the strong 3rd wave now in progress has done the bulk of the work in taking the stock down to the mid-$13 level; however, this wave (normally the longest/strongest in any valid 5-wave impulse pattern) may be at/near its logical termination point: 1. Wave 3 is 200% the length of wave 1 and has also taken nearly 162% of the time needed for wave one to complete. 2. The 127%/138% Fibonacci retracements of the wave C (4) low are at 13/39/12.98, respectively, and are in general agreement with the wave 3 low plotted on the chart near 13.20. 3. The 21-day Detrend oscillator is in record low territory, also suggesting that a relief rally (wave 4) is due to appear soon. Moving to the daily Keltner channel chart in Figure 2, you find even more potential reversal goodies to gaze at: A. The break below the extreme lower Keltner band is the first such occurrence in more than a decade; however, daily volume has been declining since the first close beneath it. B. Two '5' profit-taking signals have also appeared after the break; these have a 90-plus percent accuracy in calling reversals within the next five to eight price bars once they appear after a long up or down trend. C. The medium-term Chaikin Money Flow (CMF)(34) has begun to stabilize, yet another hint of a soon reversal. 4. The long tail on the last daily candle (October 8, 2014 as of 1300 ET) is yet another powerful bullish reversal setup. |
|
| Figure 2. Ford shows even more signs of an impending reversal as a bullish, long shadow candle appears on October 8, 2014 after an excursion beneath the extreme lower Keltner band. |
| Graphic provided by: TradeStation. |
| Graphic provided by: Elite Trader Indicators by Fibozachi.com. |
| |
| If Ford can move above Wednesday's (October 8, 2014) high of 14.25 on heavy volume, the stage will be set for the first burst higher for wave 4 — an opportune time to start selling out-of-the-money near-term options, such as the November 2014 F $13.00 puts, which have a good bid/ask spread, liquidity, and open interest. With F projected to hit at least 14.75/15.00 on the wave 4 rally, these puts will lose value quickly as their delta and theta factors combine to provide a usable edge for skilled option traders. The big idea, should F move higher as anticipated, is to let the puts lose at least 50-70% of their value and then buy them back for a profit. On a strong rally this can happen in just a day or two, allowing you to quickly cash out and deploy the cash elsewhere. Keep your account risk at 1% max and remember to trade wisely until we meet here again. |
Freelance financial markets writer and online publisher of the Trendzetterz.com S&P 500 Weekly Forecast service.
| Title: | Market consultant and writer |
| Company: | Trendzetterz |
| Address: | 81 Hickory Hollow Drive |
| Crossville, TN 38555 | |
| Phone # for sales: | 904-303-4814 |
| Website: | trendzetterz.com |
| E-mail address: | support@trendzetterz.com |
Traders' Resource Links | |
| Trendzetterz has not added any product or service information to TRADERS' RESOURCE. | |
Click here for more information about our publications!
PRINT THIS ARTICLE

Request Information From Our Sponsors
- StockCharts.com, Inc.
- Candle Patterns
- Candlestick Charting Explained
- Intermarket Technical Analysis
- John Murphy on Chart Analysis
- John Murphy's Chart Pattern Recognition
- John Murphy's Market Message
- MurphyExplainsMarketAnalysis-Intermarket Analysis
- MurphyExplainsMarketAnalysis-Visual Analysis
- StockCharts.com
- Technical Analysis of the Financial Markets
- The Visual Investor
- VectorVest, Inc.
- Executive Premier Workshop
- One-Day Options Course
- OptionsPro
- Retirement Income Workshop
- Sure-Fire Trading Systems (VectorVest, Inc.)
- Trading as a Business Workshop
- VectorVest 7 EOD
- VectorVest 7 RealTime/IntraDay
- VectorVest AutoTester
- VectorVest Educational Services
- VectorVest OnLine
- VectorVest Options Analyzer
- VectorVest ProGraphics v6.0
- VectorVest ProTrader 7
- VectorVest RealTime Derby Tool
- VectorVest Simulator
- VectorVest Variator
- VectorVest Watchdog