

HOT TOPICS LIST
- MACD
- Fibonacci
- RSI
- Gann
- ADXR
- Stochastics
- Volume
- Triangles
- Futures
- Cycles
- Volatility
- ZIGZAG
- MESA
- Retracement
- Aroon
INDICATORS LIST
LIST OF TOPICS
PRINT THIS ARTICLE
by Donald W. Pendergast, Jr.
Down by 18% since its July 31, 2014 high, shares of Apache Corp. are homing in on a high probability bullish reversal zone.
Position: N/A
Donald W. Pendergast, Jr.
Freelance financial markets writer and online publisher of the Trendzetterz.com S&P 500 Weekly Forecast service.
PRINT THIS ARTICLE
REVERSAL
APA: Elliott Wave, Keltners, and Fibs Agree On Reversal
10/08/14 02:59:46 PMby Donald W. Pendergast, Jr.
Down by 18% since its July 31, 2014 high, shares of Apache Corp. are homing in on a high probability bullish reversal zone.
Position: N/A
| As you gain experience with technical indicators, market dynamics, repetitive price patterns, and the ability to visually identify attractive trade setups, you will invariably begin to favor certain groupings of indicators and then construct charting templates, mechanical systems, and workflows that can help the quality of your analysis and trading bottom line. The daily charts shown here for Apache Corp. (APA) may give you a few ideas as to how to put several analysis techniques together to identify high probability reversal zones in high volume stocks that tend to make powerful swing/trend moves. |
|
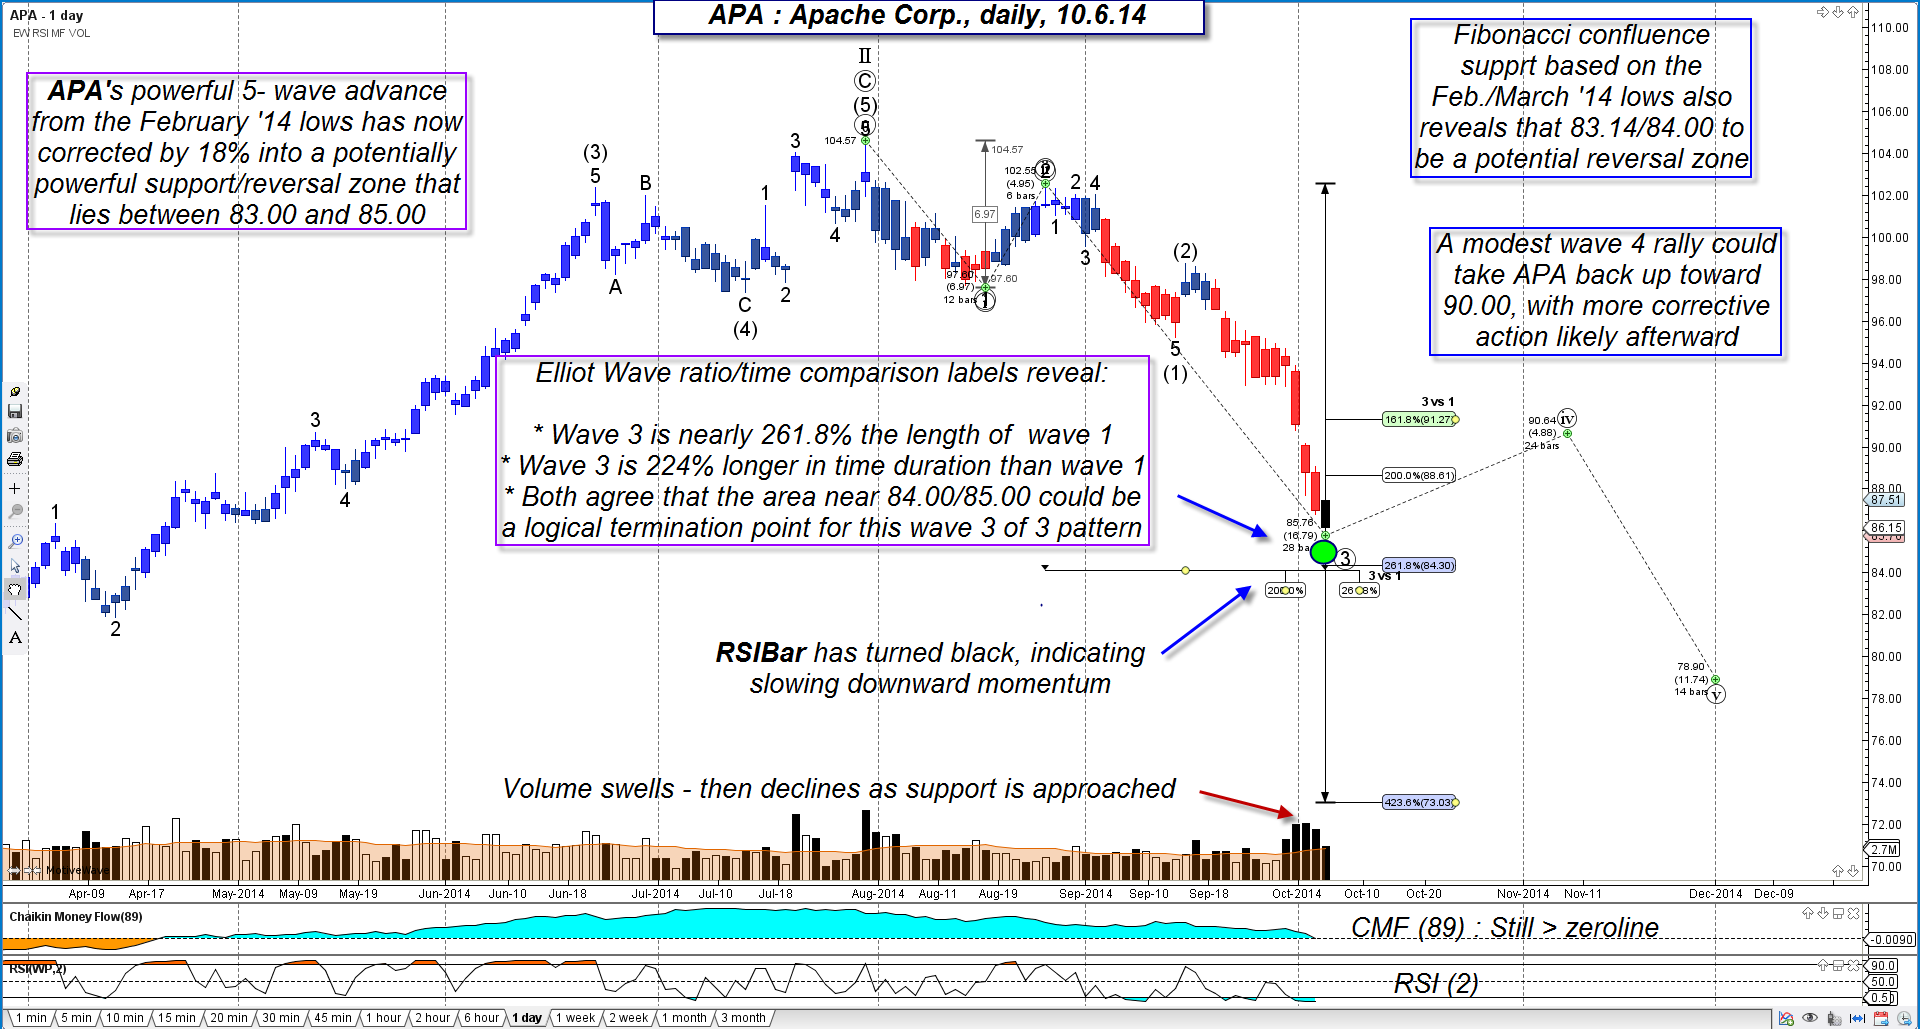
| Figure 1. Daily chart of Apache Corp. (APA) displaying Elliott waves. A 3rd wave down of a larger degree third wave down may be nearing a termination point; time/price agreement is close to 84.00/85.00. Fibonacci support also exists between 83.14/84.00. |
| Graphic provided by: MotiveWave.com. |
| |
| Three of the most powerful and effective trading tools available are: 1. Fibonacci ratios 2. Elliott Waves 3. Keltner channels At various times, when these three dynamics are all in agreement that a high probability trend reversal is due, it gives alert traders a heads up to either: a. Begin scaling out of and/or aggressively protecting open positions b. Start looking for valid reversal confirmations in preparation for a tradable move in the new swing direction. In the chart in Figure 1, you find that APA had a wonderful five-wave rally from early February 2014 to late July 2014 and that it's now in a wave three down of a larger third wave impulse pattern; wave counts can and do change over time, but this particular count strongly suggests that both of the 3rd waves are at/near a significant termination zone, after which a tradable wave 4 rally should commence. Some of the clues here include the following: * Wave 3 is nearly 261.8% the length of wave 1 * Wave 3 is 224% longer in time duration than wave 1 * Both agree that the area near 84.00/85.00 could be a logical termination point for this wave 3 of 3 pattern (green circle). In addition, two Fibonacci retracements rooted in the February/March 2014 lows reveal 78.6% support between 83.14/84.00, just a little below the dual wave 3 termination zone. Long-term money flow (CMF)(89) remains close to its zero line, yet another sign that this decline may soon end, with a wave 4 bounce ahead. |
|
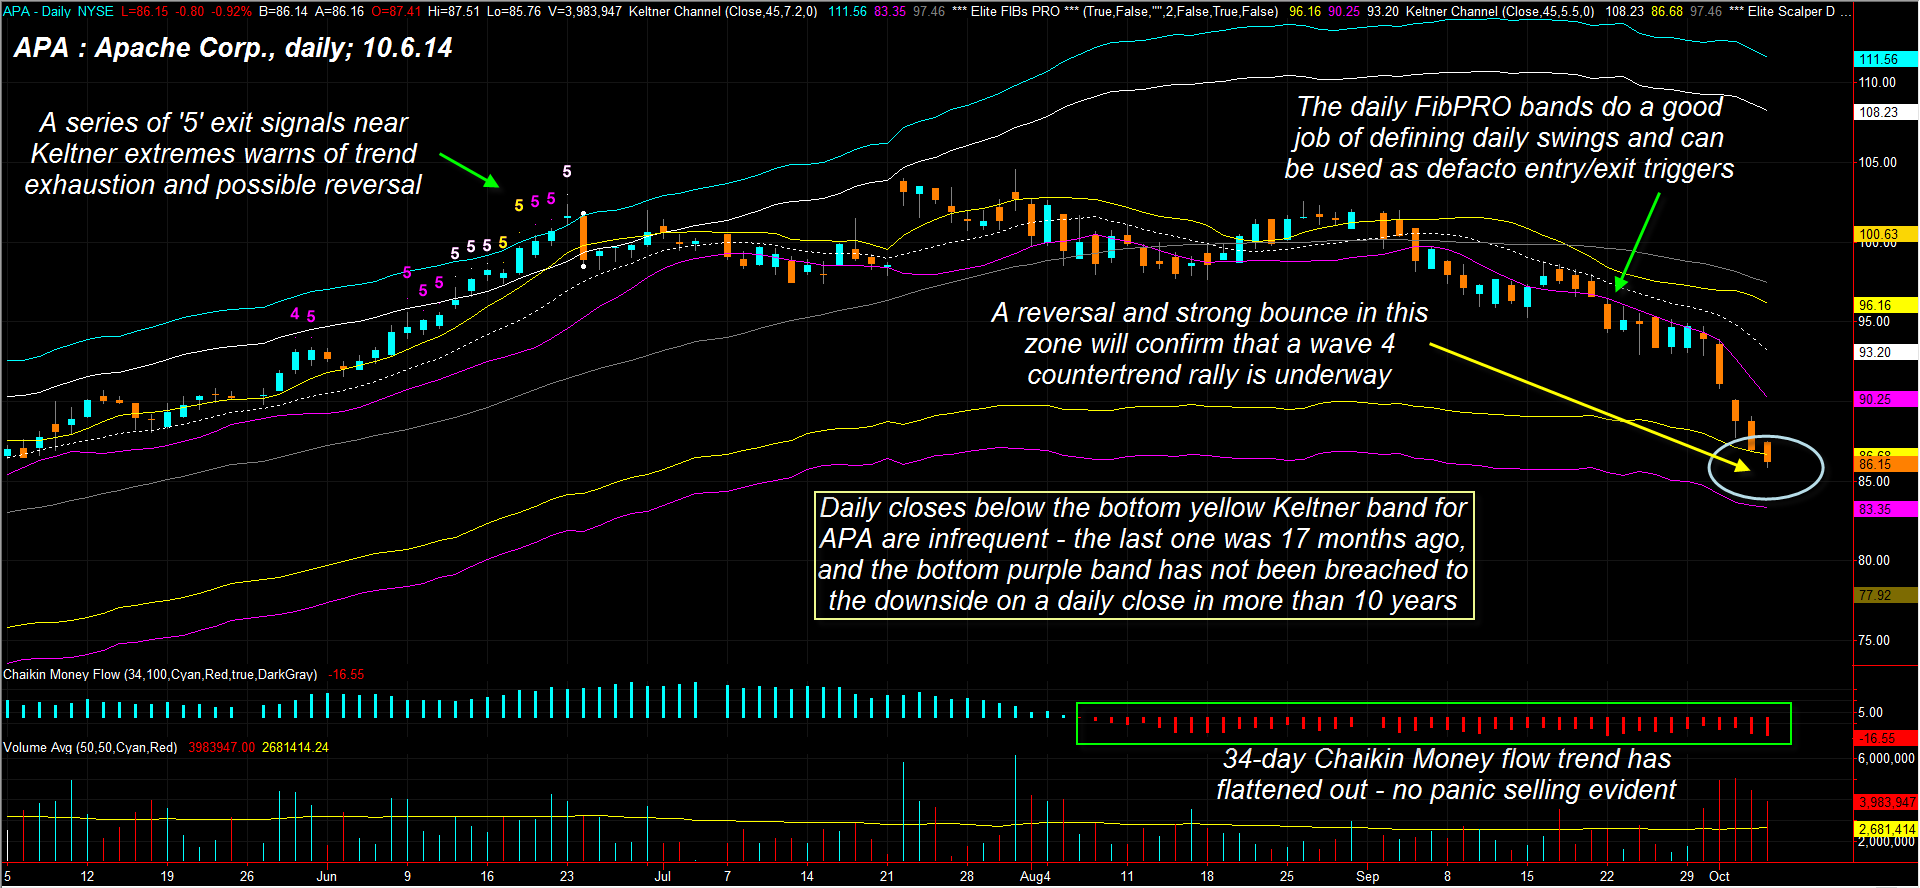
| Figure 2. Daily chart of APA displaying Keltner channels. APA is also in a potentially strong Keltner channel reversal zone; APA has not made a daily close beneath the lower purple band in more than a decade. |
| Graphic provided by: TradeStation. |
| Graphic provided by: Elite Trader Indicators by Fibozachi.com. |
| |
| Looking at the chart in Figure 2, you find that APA is on track to make its first daily close beneath the bottom yellow Keltner band since May 2012; these lower Keltners are normally major support for most stocks and APA has not made a daily close below the extreme lower (purple) band in more than 10 years. Given the Elliott Wave and Fibonacci support evident between 83.00 and 85.00 on the chart in Figure 1, it will be helpful to watch for signs of reversal prior to a daily close beneath the lower purple band. If/when this happens, it's 'all systems go' for a strong wave 4 rally, one that should easily hit 90.00 before an new wave 5 down starts. This is my current projection, but as always the action on the chart always has the final say. Experienced option sellers should start looking for out-of-the money puts (such as the November 2014 APA $80.00 puts); if you can snag a 50-60% gain on a reversal, book the profits and go back to cash. Stock traders should wait for APA to rise above the highest high of the previous three sessions before going long, keeping a fairly close trailing stop until the trade gains momentum or the wave 4 target of 90.00 is reached. Keep your account risk at 1% and remember to trade wisely until we meet here again. |
Freelance financial markets writer and online publisher of the Trendzetterz.com S&P 500 Weekly Forecast service.
| Title: | Market consultant and writer |
| Company: | Trendzetterz |
| Address: | 81 Hickory Hollow Drive |
| Crossville, TN 38555 | |
| Phone # for sales: | 904-303-4814 |
| Website: | trendzetterz.com |
| E-mail address: | support@trendzetterz.com |
Traders' Resource Links | |
| Trendzetterz has not added any product or service information to TRADERS' RESOURCE. | |
Click here for more information about our publications!
Comments

Request Information From Our Sponsors
- StockCharts.com, Inc.
- Candle Patterns
- Candlestick Charting Explained
- Intermarket Technical Analysis
- John Murphy on Chart Analysis
- John Murphy's Chart Pattern Recognition
- John Murphy's Market Message
- MurphyExplainsMarketAnalysis-Intermarket Analysis
- MurphyExplainsMarketAnalysis-Visual Analysis
- StockCharts.com
- Technical Analysis of the Financial Markets
- The Visual Investor
- VectorVest, Inc.
- Executive Premier Workshop
- One-Day Options Course
- OptionsPro
- Retirement Income Workshop
- Sure-Fire Trading Systems (VectorVest, Inc.)
- Trading as a Business Workshop
- VectorVest 7 EOD
- VectorVest 7 RealTime/IntraDay
- VectorVest AutoTester
- VectorVest Educational Services
- VectorVest OnLine
- VectorVest Options Analyzer
- VectorVest ProGraphics v6.0
- VectorVest ProTrader 7
- VectorVest RealTime Derby Tool
- VectorVest Simulator
- VectorVest Variator
- VectorVest Watchdog