HOT TOPICS LIST
- MACD
- Fibonacci
- RSI
- Gann
- ADXR
- Stochastics
- Volume
- Triangles
- Futures
- Cycles
- Volatility
- ZIGZAG
- MESA
- Retracement
- Aroon
INDICATORS LIST
LIST OF TOPICS
PRINT THIS ARTICLE
by Koos van der Merwe
Here's a company worth looking at that could be a long term hold.
Position: Buy
Koos van der Merwe
Has been a technical analyst since 1969, and has worked as a futures and options trader with First Financial Futures in Johannesburg, South Africa.
PRINT THIS ARTICLE
TECHNICAL ANALYSIS
GW Pharmaceuticals A Buy?
10/07/14 05:14:59 PMby Koos van der Merwe
Here's a company worth looking at that could be a long term hold.
Position: Buy
| GW Pharmaceuticals is a biopharmaceutical company focused on discovering, developing, and commercializing novel therapeutics from its proprietary cannabinoid product platform in a broad range of disease areas. GW Pharmaceuticals commercialized the world's first plant-derived cannabinoid prescription drug, Sativex, which is approved for the treatment of spasticity due to multiple sclerosis in 26 countries outside the United States. The company has a deep pipeline of additional cannabinoid product candidates, including Epidiolex in the treatment of childhood epilepsy. |

|
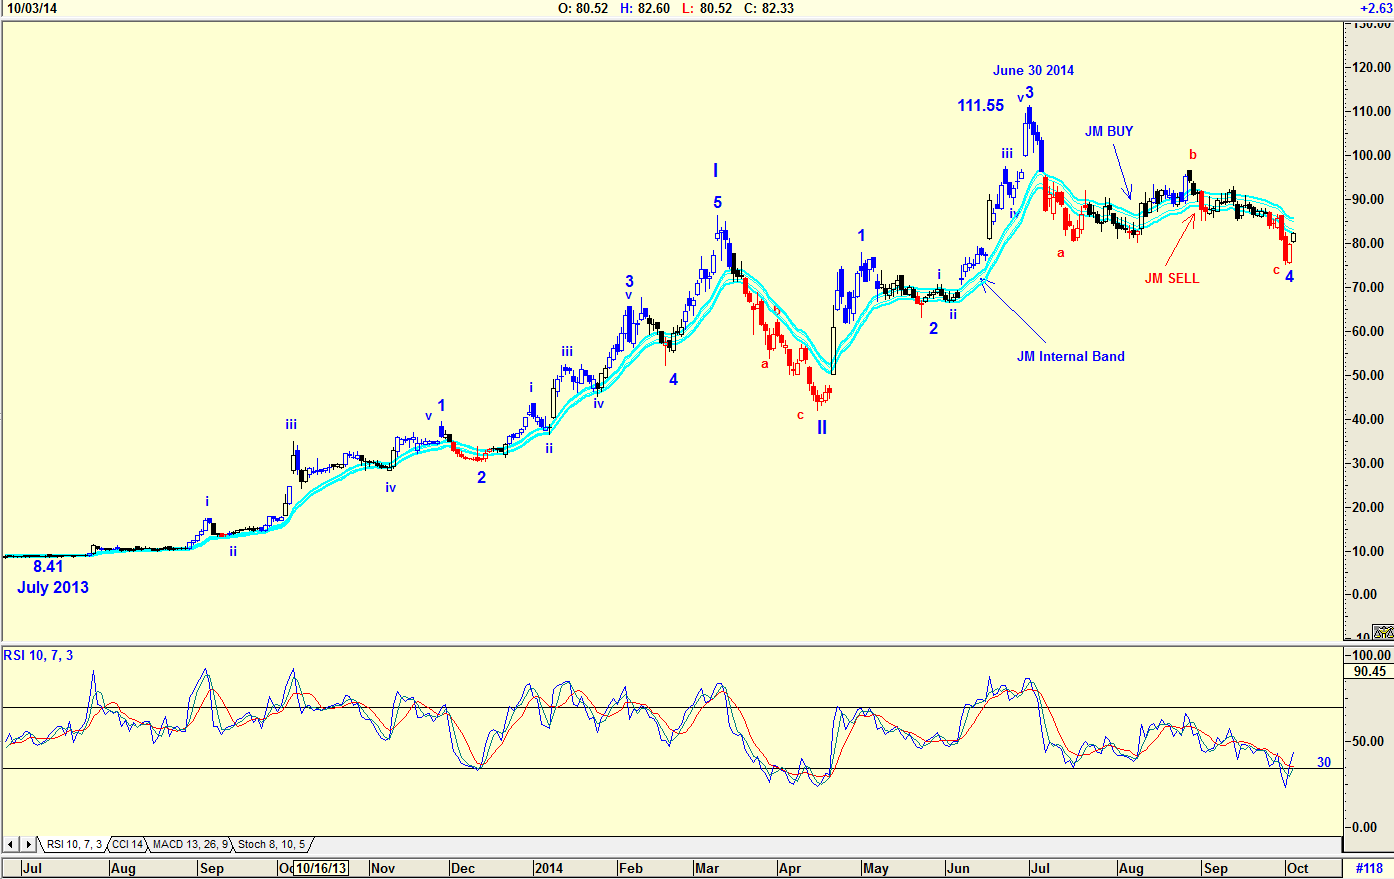
| Figure 1. Daily Chart With Elliott Wave Count. The share price could be completing a Wave 4 of a major WAVE III. |
| Graphic provided by: AdvancedGET. |
| |
| The chart in Figure 1 is a daily chart showing how the price of the GW Pharmaceuticals (GWPH) has risen from $8.41 in July 2013 to a high of $111.55 by June 30, 2014. The chart shows an Elliott Wave count suggesting that the share price could be completing a Wave 4 of a major WAVE III. The relative strength index (RSI) has given a buy signal by breaking above the 30 horizontal line. The share price has not given a JM Internal Band buy signal. A JM Internal Band is a 15-period simple moving average offset by 2% positive and 2% negative. A move above the upper band suggests a buy signal. Conservative investors could wait for a move above the upper JM Internal Band before buying. |

|
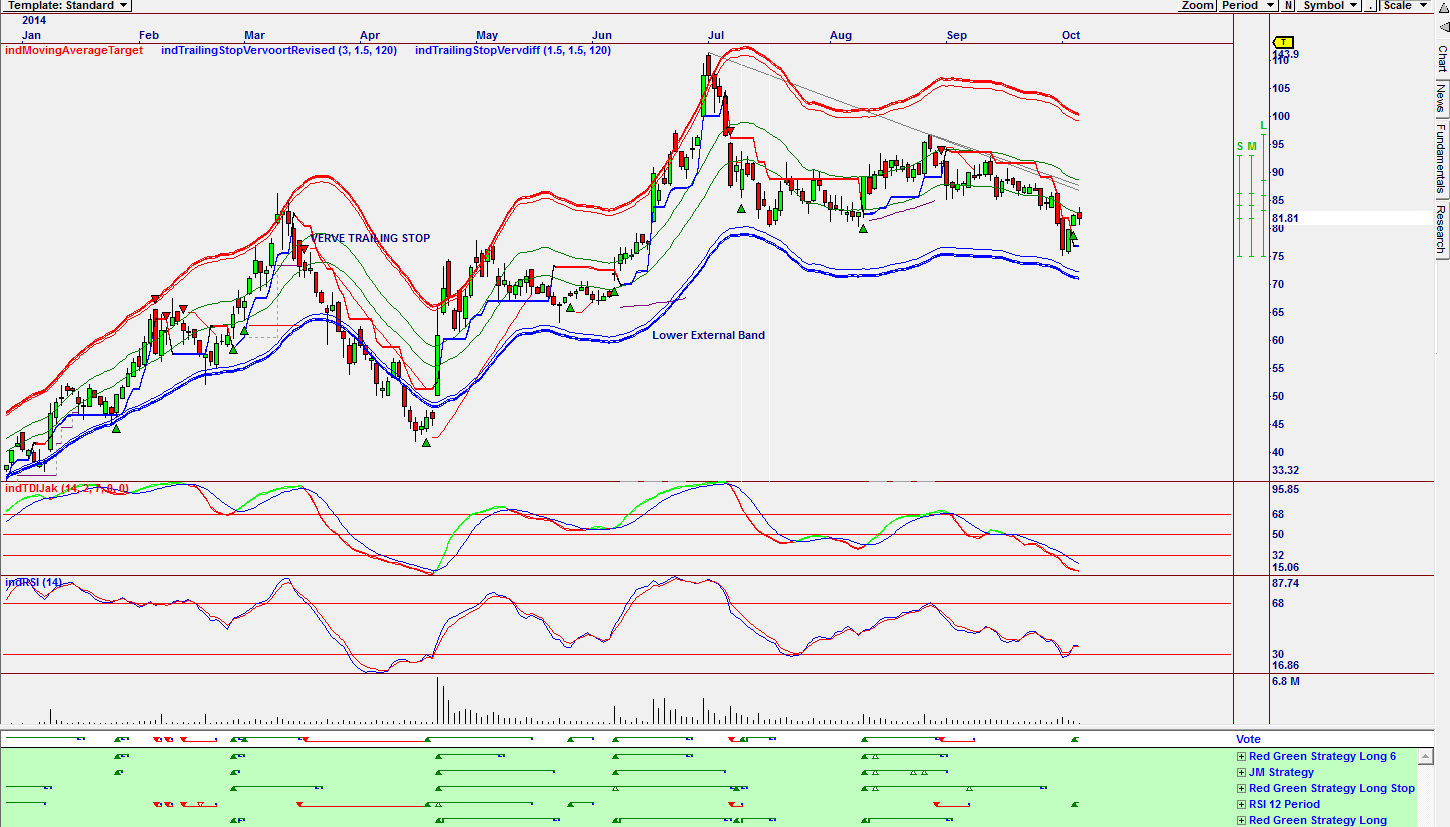
| Figure 2. Daily Chart Showing Vote Line Buy Signal. Could a retest of the high of $111.55 be in the cards? |
| Graphic provided by: Omnitrader. |
| |
| The chart in Figure 2 is an Omnitrader chart that shows the Vote line suggesting a buy signal based on the RSI 12-period strategy shown in green below the Vote line. Do note that the indTDIJak indicator has not given a buy. This indicator is usually slower than the RSI and can be used by more conservative investors. Note also how previous buy signals given by the Vote line have been successful. GWPH has corrected since July, but it seems to have formed a bottom and a move up to retest the high of $111.55 could be in the cards. |
Has been a technical analyst since 1969, and has worked as a futures and options trader with First Financial Futures in Johannesburg, South Africa.
| Address: | 3256 West 24th Ave |
| Vancouver, BC | |
| Phone # for sales: | 6042634214 |
| E-mail address: | petroosp@gmail.com |
Click here for more information about our publications!
PRINT THIS ARTICLE

Request Information From Our Sponsors
- StockCharts.com, Inc.
- Candle Patterns
- Candlestick Charting Explained
- Intermarket Technical Analysis
- John Murphy on Chart Analysis
- John Murphy's Chart Pattern Recognition
- John Murphy's Market Message
- MurphyExplainsMarketAnalysis-Intermarket Analysis
- MurphyExplainsMarketAnalysis-Visual Analysis
- StockCharts.com
- Technical Analysis of the Financial Markets
- The Visual Investor
- VectorVest, Inc.
- Executive Premier Workshop
- One-Day Options Course
- OptionsPro
- Retirement Income Workshop
- Sure-Fire Trading Systems (VectorVest, Inc.)
- Trading as a Business Workshop
- VectorVest 7 EOD
- VectorVest 7 RealTime/IntraDay
- VectorVest AutoTester
- VectorVest Educational Services
- VectorVest OnLine
- VectorVest Options Analyzer
- VectorVest ProGraphics v6.0
- VectorVest ProTrader 7
- VectorVest RealTime Derby Tool
- VectorVest Simulator
- VectorVest Variator
- VectorVest Watchdog
