HOT TOPICS LIST
- MACD
- Fibonacci
- RSI
- Gann
- ADXR
- Stochastics
- Volume
- Triangles
- Futures
- Cycles
- Volatility
- ZIGZAG
- MESA
- Retracement
- Aroon
INDICATORS LIST
LIST OF TOPICS
PRINT THIS ARTICLE
by Donald W. Pendergast, Jr.
Down by nearly 82% since its May 2008 peak, shares of Transocean Ltd. may be getting close to a major low.
Position: N/A
Donald W. Pendergast, Jr.
Freelance financial markets writer and online publisher of the Trendzetterz.com S&P 500 Weekly Forecast service.
PRINT THIS ARTICLE
KELTNER CHANNELS
RIG: Signs Of Trend Exhaustion?
10/07/14 05:08:09 PMby Donald W. Pendergast, Jr.
Down by nearly 82% since its May 2008 peak, shares of Transocean Ltd. may be getting close to a major low.
Position: N/A
| The fundamental forces driving the pricing power of offshore energy drilling/exploration are bearish near term, but for investors looking to snag a healthy dividend and a possible rebound, shares of Transocean Ltd. (RIG) may soon attract the value stock crowd. Here's a closer look at RIG's daily and weekly charts. |

|
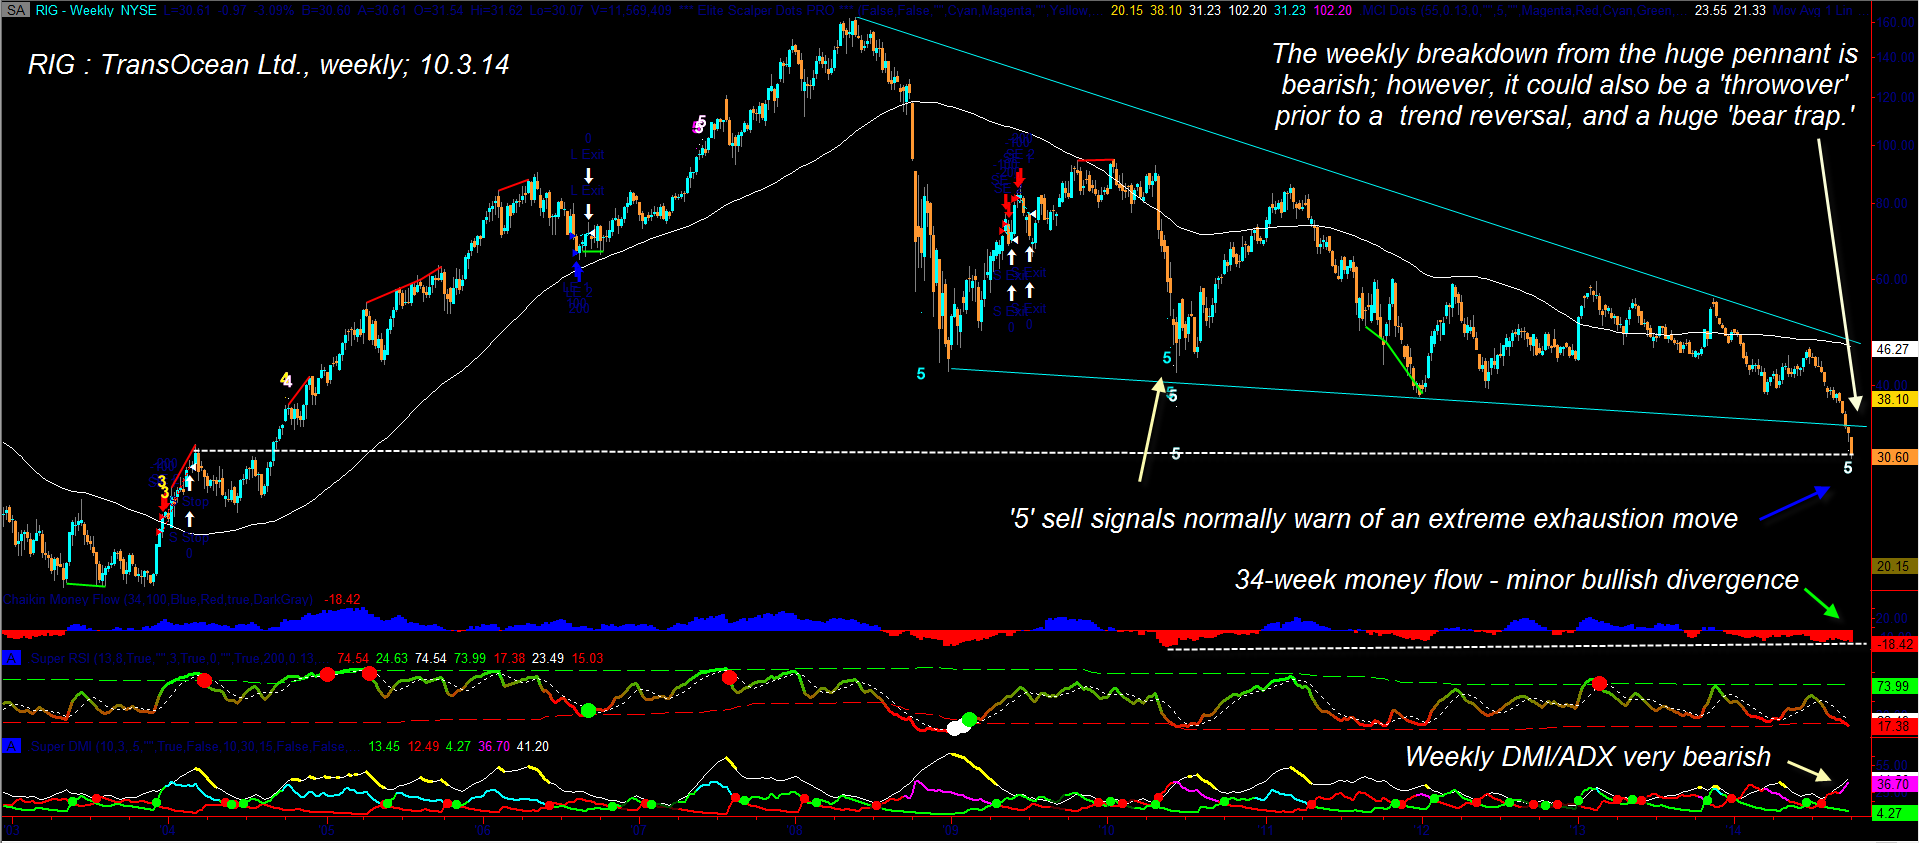
| Figure 1. Weekly Chart Of Transocean Ltd. (RIG): The breakdown from the pattern is ominous, but bullish money flow divergences suggest the "smart money" may be starting to nibble on RIG at such depressed prices. |
| Graphic provided by: TradeStation. |
| Graphic provided by: Elite Trader Indicators by Fibozachi.com. |
| |
| RIG's decline since the days of $140-plus crude oil (remember paying $5 per gallon in the early summer of 2008?) has been quite dramatic, as have those of many of its peers on the offshore energy exploration/drilling group; RIG has dropped by as much as 81.55% since May 2008 and may yet have more downside ahead — or does it? RIG's weekly chart (Figure 1) reveals a giant pennant formation, one from which it has begun to plunge from; presently there is only one weekly swing high at 29.90 from March 2004 acting as support — the stock traded as low as 30.07 today, October 3, 2014; if this is taken out on big volume the next lower support is at 24.49. Certainly, the stock has extreme downside momentum, more than enough to keep sellers selling it short. However, there are some things to be aware of here: 1. The '5' exhaustion sell signal is warning that a reversal is due soon. 2. The 34-week Chaikin Money Flow (CMF)(34) depicts two bullish divergences (calculated from different swing lows). 3. RIG's annual dividend yield has been pushed up to 9.5% as the stock has deflated; those looking for yield may start to nibble more aggressively once the rate hits 10% or higher. 4. Weekly Elliott Wave analysis reveals possible wave exhaustion zones between 25.14 and 28.45; the timing window for such wave termination is from October 10 - November 30, 2014. A dip toward 25.00 would give RIG an annual dividend yield of 12%, at the current payout rate. |

|
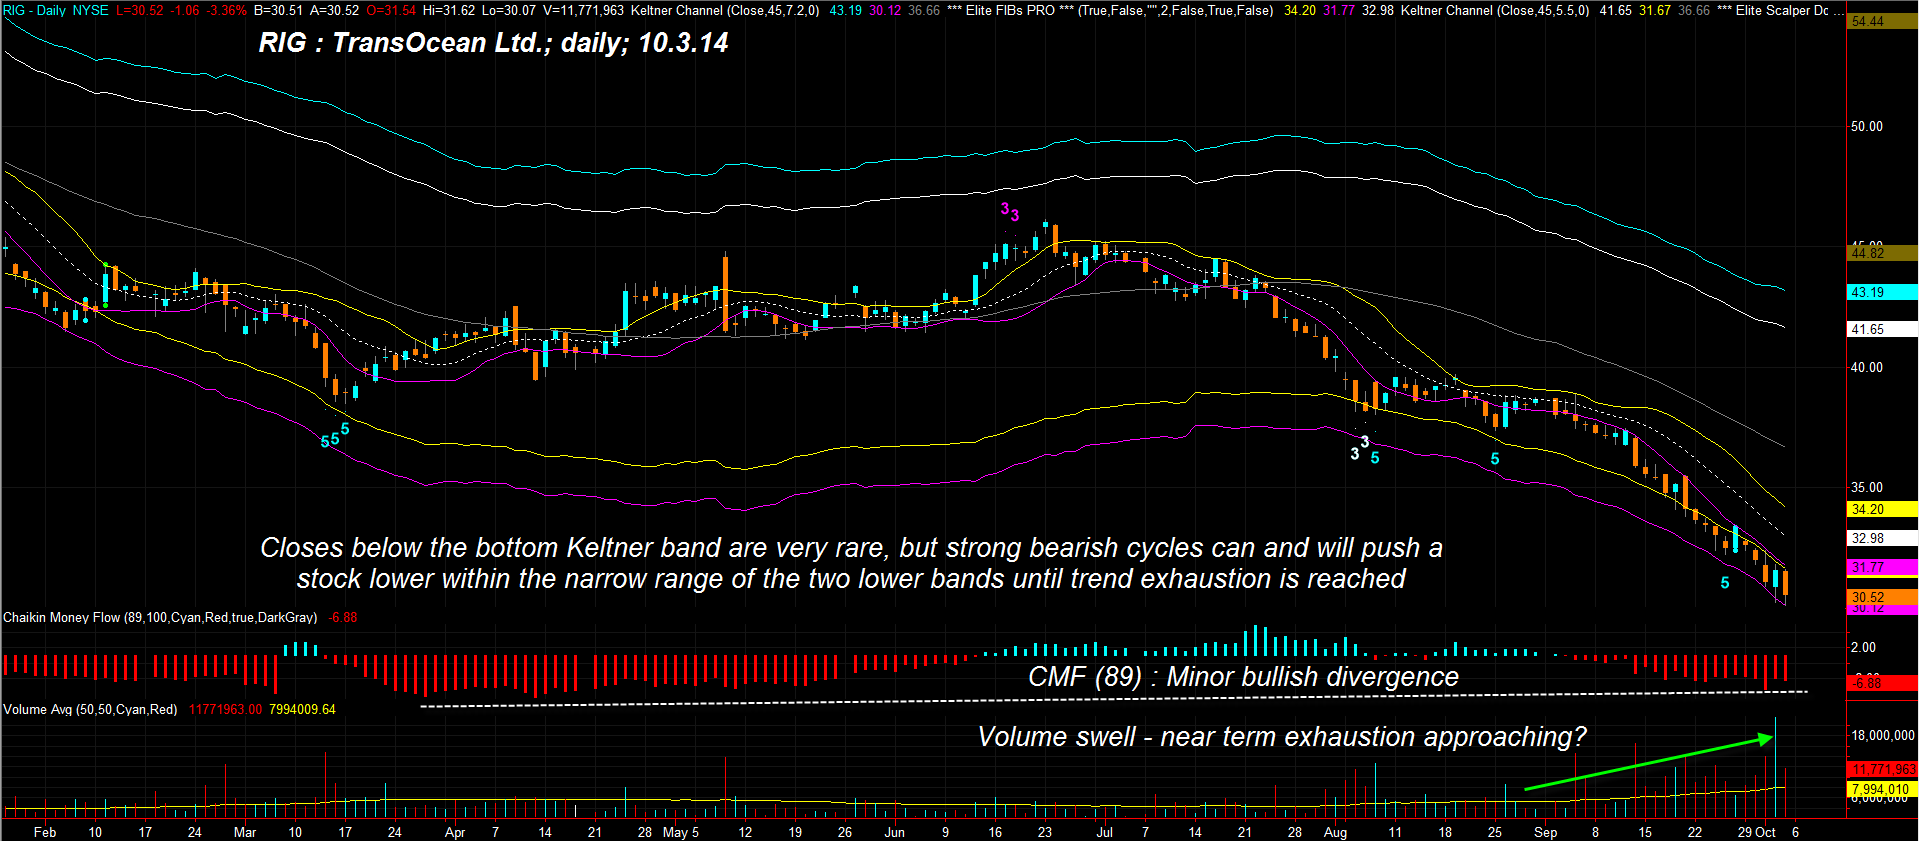
| Figure 2. Daily Chart Of RIG. RIG's daily downtrend is intensifying, hugging the lower Keltner channels. Bullish money flow divergences and steadily increasing volumes may be paving way for a "panic sell" day that precedes a major bottoming phase. |
| Graphic provided by: TradeStation. |
| Graphic provided by: Elite Trader Indicators by Fibozachi.com. |
| |
| The daily chart in Figure 2 reveals a stock literally "going down the tube" — the narrow declining channel formed by two different Keltner channels, that is; closes beyond the extreme lower band are extremely rare, but the stock can and will hug this inner boundary until trend exhaustion begins to set in. And as on the weekly chart in Figure 1, RIG also shows pronounced bullish money flow divergences; note the progressive swell in daily volume as the latest downswing gathered steam. Blow off volume on panic selling is also another tipoff that a major low is approaching. Perhaps the only way to play RIG is to patiently wait for the ultimate low to form and for a confirmed trend reversal to take hold — especially on its weekly chart. Once you see that, RIG could be a great covered call-plus dividend trade if you choose your call strikes wisely; for value and dividend investors this could be a powerful income-generating combination that has the potential for capital gains, too. Trade and invest wisely until we meet here again. |
Freelance financial markets writer and online publisher of the Trendzetterz.com S&P 500 Weekly Forecast service.
| Title: | Market consultant and writer |
| Company: | Trendzetterz |
| Address: | 81 Hickory Hollow Drive |
| Crossville, TN 38555 | |
| Phone # for sales: | 904-303-4814 |
| Website: | trendzetterz.com |
| E-mail address: | support@trendzetterz.com |
Traders' Resource Links | |
| Trendzetterz has not added any product or service information to TRADERS' RESOURCE. | |
Click here for more information about our publications!
PRINT THIS ARTICLE

Request Information From Our Sponsors
- StockCharts.com, Inc.
- Candle Patterns
- Candlestick Charting Explained
- Intermarket Technical Analysis
- John Murphy on Chart Analysis
- John Murphy's Chart Pattern Recognition
- John Murphy's Market Message
- MurphyExplainsMarketAnalysis-Intermarket Analysis
- MurphyExplainsMarketAnalysis-Visual Analysis
- StockCharts.com
- Technical Analysis of the Financial Markets
- The Visual Investor
- VectorVest, Inc.
- Executive Premier Workshop
- One-Day Options Course
- OptionsPro
- Retirement Income Workshop
- Sure-Fire Trading Systems (VectorVest, Inc.)
- Trading as a Business Workshop
- VectorVest 7 EOD
- VectorVest 7 RealTime/IntraDay
- VectorVest AutoTester
- VectorVest Educational Services
- VectorVest OnLine
- VectorVest Options Analyzer
- VectorVest ProGraphics v6.0
- VectorVest ProTrader 7
- VectorVest RealTime Derby Tool
- VectorVest Simulator
- VectorVest Variator
- VectorVest Watchdog
