HOT TOPICS LIST
- MACD
- Fibonacci
- RSI
- Gann
- ADXR
- Stochastics
- Volume
- Triangles
- Futures
- Cycles
- Volatility
- ZIGZAG
- MESA
- Retracement
- Aroon
INDICATORS LIST
LIST OF TOPICS
PRINT THIS ARTICLE
by Koos van der Merwe
Warren Buffet announced that he bought stocks when the market crashed on Thursday, September 25, 2014.
Position: Accumulate
Koos van der Merwe
Has been a technical analyst since 1969, and has worked as a futures and options trader with First Financial Futures in Johannesburg, South Africa.
PRINT THIS ARTICLE
RSI
In A Down Market What Do You Buy?
10/06/14 04:56:16 PMby Koos van der Merwe
Warren Buffet announced that he bought stocks when the market crashed on Thursday, September 25, 2014.
Position: Accumulate
| The rule is that when everyone is selling then those in the know start buying. With the market correcting on Thursday morning, Warren Buffett in an interview with CNBC announced that he had started buying stocks. Knowing this, what stocks would you buy? Would you buy the stocks that Warren Buffett has bought or would you decide to stay away from them and make your own decision as to what to buy? That is the question. The answer? Do your own research. Warren Buffett's strategy is to buy & hold for the long-term. Yours may be buy and take a profit when it is presented. One section of the market I look at when the market corrects are the banks. They have suffered badly since their bubble burst, but they are correcting their errors and are looking good. |

|
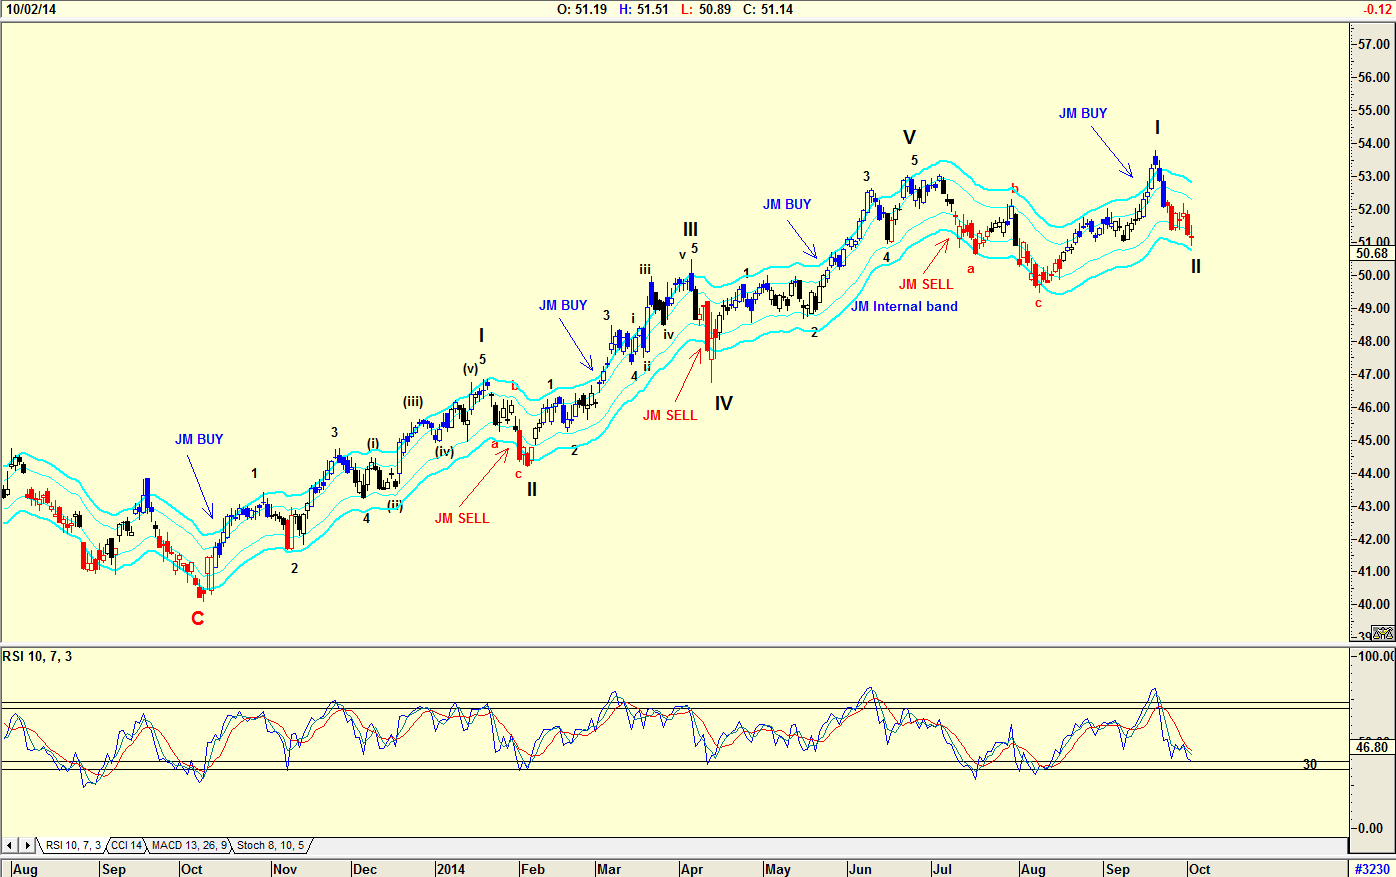
| Figure 1. DAILY CHART OF WELLS FARGO. Here you see the correction in a WAVE II of a new five wave bull trend. The RSI is close to suggesting a buy. |
| Graphic provided by: AdvancedGET. |
| |
| The chart in Figure 1 is a daily chart of Wells Fargo (WFC), showing the correction in a WAVE II of a new five wave bull trend. The relative strength index (RSI) is close to suggesting a buy by dropping below and then rising above the 30 horizontal line. Note that the JM Internal Band is still suggesting that the share is in a buy mode, because the share price has not broken below the lower band giving a sell signal. The JM Internal Band is a 15-period simple moving average offset by 2% positive and 2% negative. A break above the upper band suggests a buy and a move below the lower band suggests a sell signal. With the WAVE II reaching a bottom, you could possibly buy the share as the RSI gives a buy signal. |

|
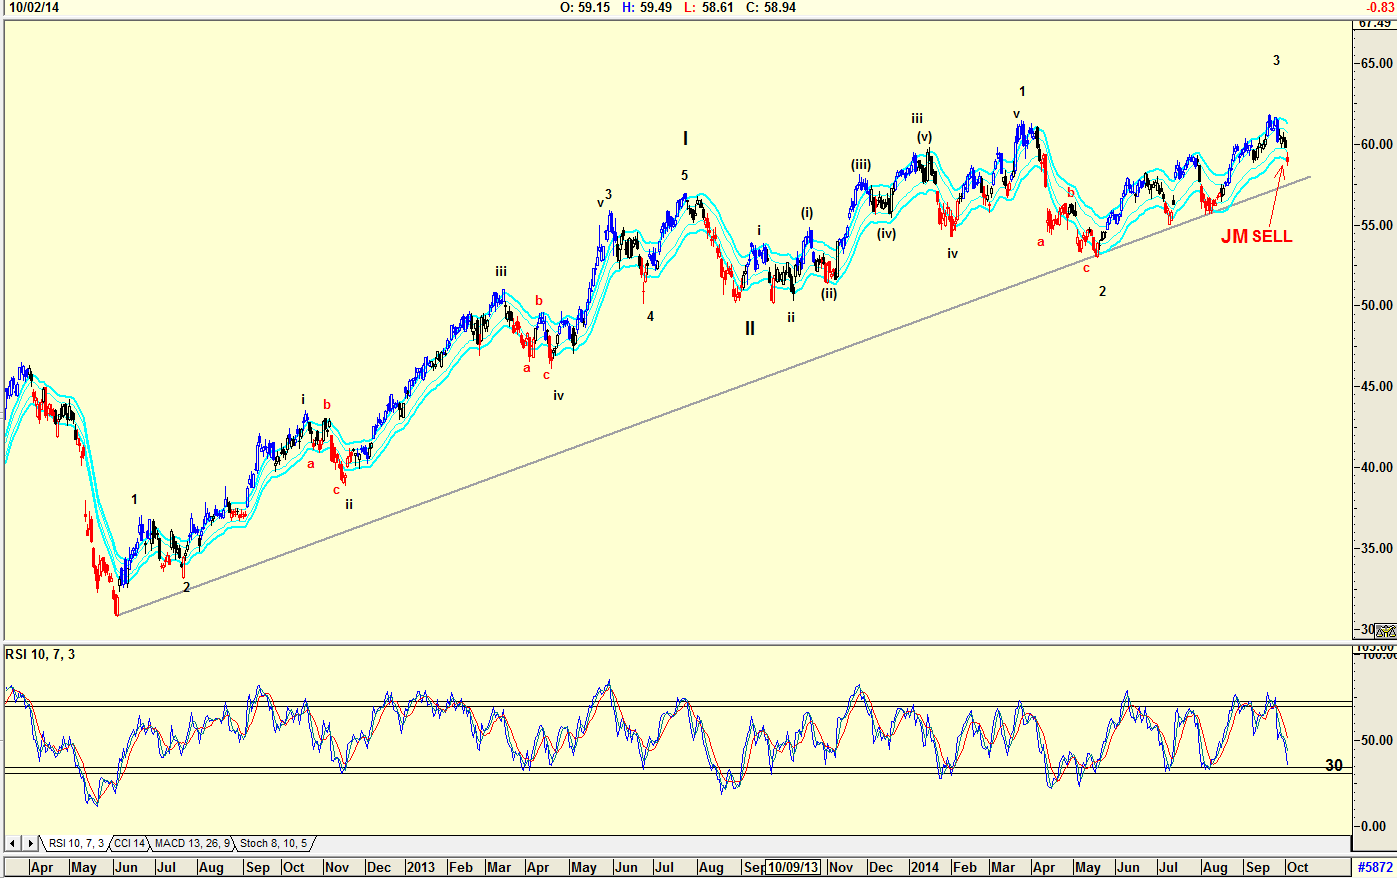
| Figure 2. DAILY CHART OF JP MORGAN CHASE. The Elliott Wave count shown could correct as price moves forward. The RSI is close to the 30 level and could suggest a buy soon. |
| Graphic provided by: AdvancedGET. |
| |
| The chart in Figure 2 is a chart of JP Morgan Chase (JPM). The Elliott Wave count shown could be open for correction as the share price moves forward. You should never forget that an Elliott Wave count is a signpost in the wilderness, and can change with a new signpost a little way down the road. Once again the RSI is close to the 30 level, and can suggest a buy soon. The JM Internal Band has recently suggested a sell. |

|
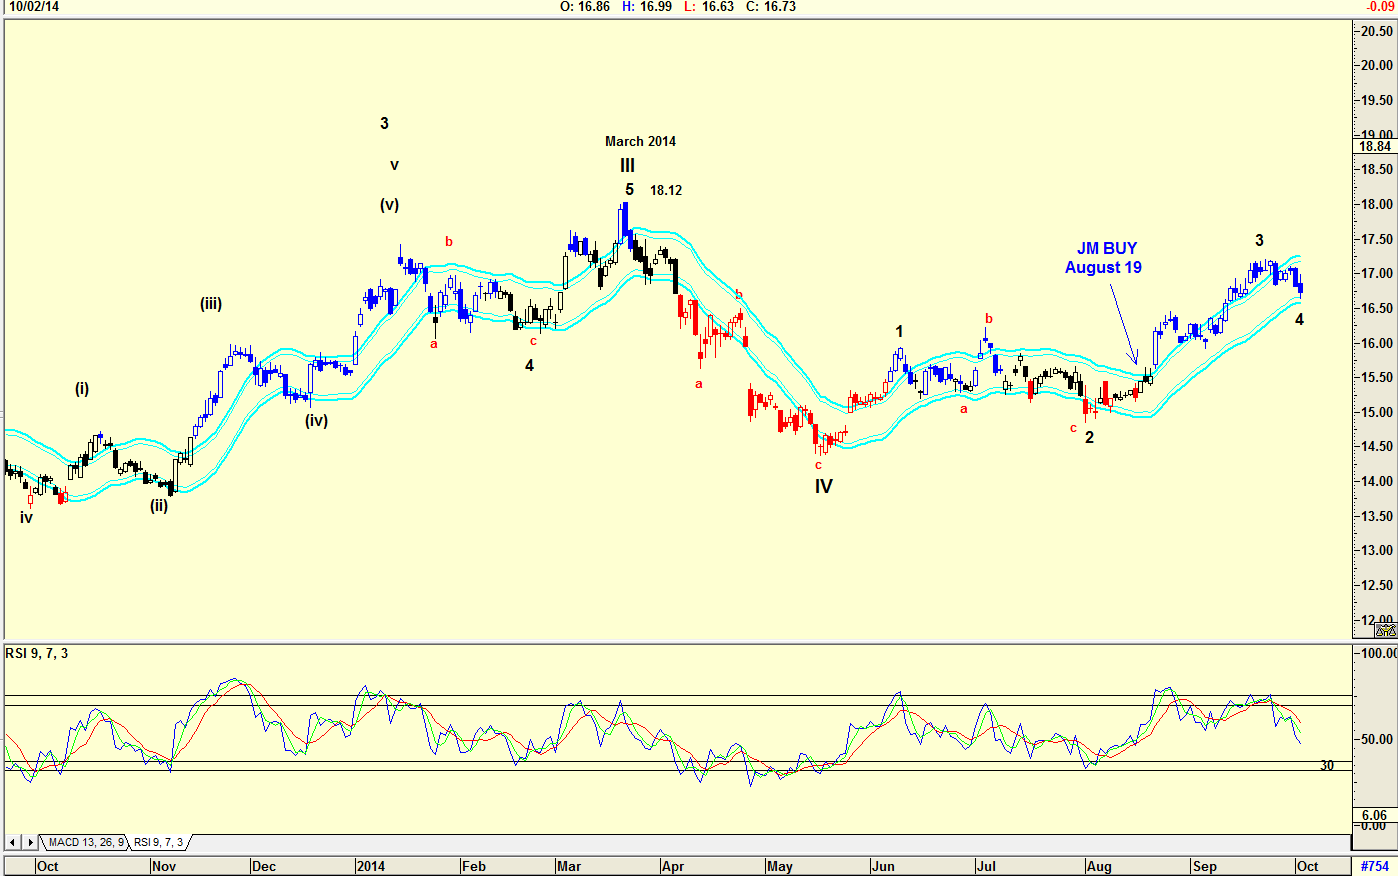
| Figure 3. DAILY CHART OF BANK OF AMERICA. This chart suggests the stock price is tracing a Wave 4 of a major WAVE V. The RSI is falling and has some ways to go before reaching the horizontal buy level at 30. |
| Graphic provided by: AdvancedGET. |
| |
| The chart in Figure 3 is a chart of Bank of America (BAC), suggesting that the share price is tracing a Wave 4 of a major WAVE V. Note the RSI is still falling and has some way to go before reaching the horizontal buy level at 30. The JM Internal Band gave a buy an August 19, 2014 and although the share price is testing the lower band, it has not given a sell signal. There are many other banking sector stocks that can be looked at like Citigroup (C), Goldman Sachs (GS), etc. Each should be charted and a decision made on whether to buy or not to buy. Incidentally, Warren Buffett bought into an auto dealership, Van Tuyl, so, following him, and assuming that he is seeing an increase in car sales, you could consider adding General Motors, Ford, and Tesla to your watchlist. Then of course if car sales do not increase, well, that's another story. |
Has been a technical analyst since 1969, and has worked as a futures and options trader with First Financial Futures in Johannesburg, South Africa.
| Address: | 3256 West 24th Ave |
| Vancouver, BC | |
| Phone # for sales: | 6042634214 |
| E-mail address: | petroosp@gmail.com |
Click here for more information about our publications!
Comments

Request Information From Our Sponsors
- StockCharts.com, Inc.
- Candle Patterns
- Candlestick Charting Explained
- Intermarket Technical Analysis
- John Murphy on Chart Analysis
- John Murphy's Chart Pattern Recognition
- John Murphy's Market Message
- MurphyExplainsMarketAnalysis-Intermarket Analysis
- MurphyExplainsMarketAnalysis-Visual Analysis
- StockCharts.com
- Technical Analysis of the Financial Markets
- The Visual Investor
- VectorVest, Inc.
- Executive Premier Workshop
- One-Day Options Course
- OptionsPro
- Retirement Income Workshop
- Sure-Fire Trading Systems (VectorVest, Inc.)
- Trading as a Business Workshop
- VectorVest 7 EOD
- VectorVest 7 RealTime/IntraDay
- VectorVest AutoTester
- VectorVest Educational Services
- VectorVest OnLine
- VectorVest Options Analyzer
- VectorVest ProGraphics v6.0
- VectorVest ProTrader 7
- VectorVest RealTime Derby Tool
- VectorVest Simulator
- VectorVest Variator
- VectorVest Watchdog
