

HOT TOPICS LIST
- MACD
- Fibonacci
- RSI
- Gann
- ADXR
- Stochastics
- Volume
- Triangles
- Futures
- Cycles
- Volatility
- ZIGZAG
- MESA
- Retracement
- Aroon
INDICATORS LIST
LIST OF TOPICS
PRINT THIS ARTICLE
by Donald W. Pendergast, Jr.
The Market Vectors Semiconductors ETF may be ready for a bullish bounce, after which a larger decline is projected.
Position: N/A
Donald W. Pendergast, Jr.
Freelance financial markets writer and online publisher of the Trendzetterz.com S&P 500 Weekly Forecast service.
PRINT THIS ARTICLE
CHART ANALYSIS
SMH: Pullback Buy Op For Nimble Traders
10/08/14 02:54:35 PMby Donald W. Pendergast, Jr.
The Market Vectors Semiconductors ETF may be ready for a bullish bounce, after which a larger decline is projected.
Position: N/A
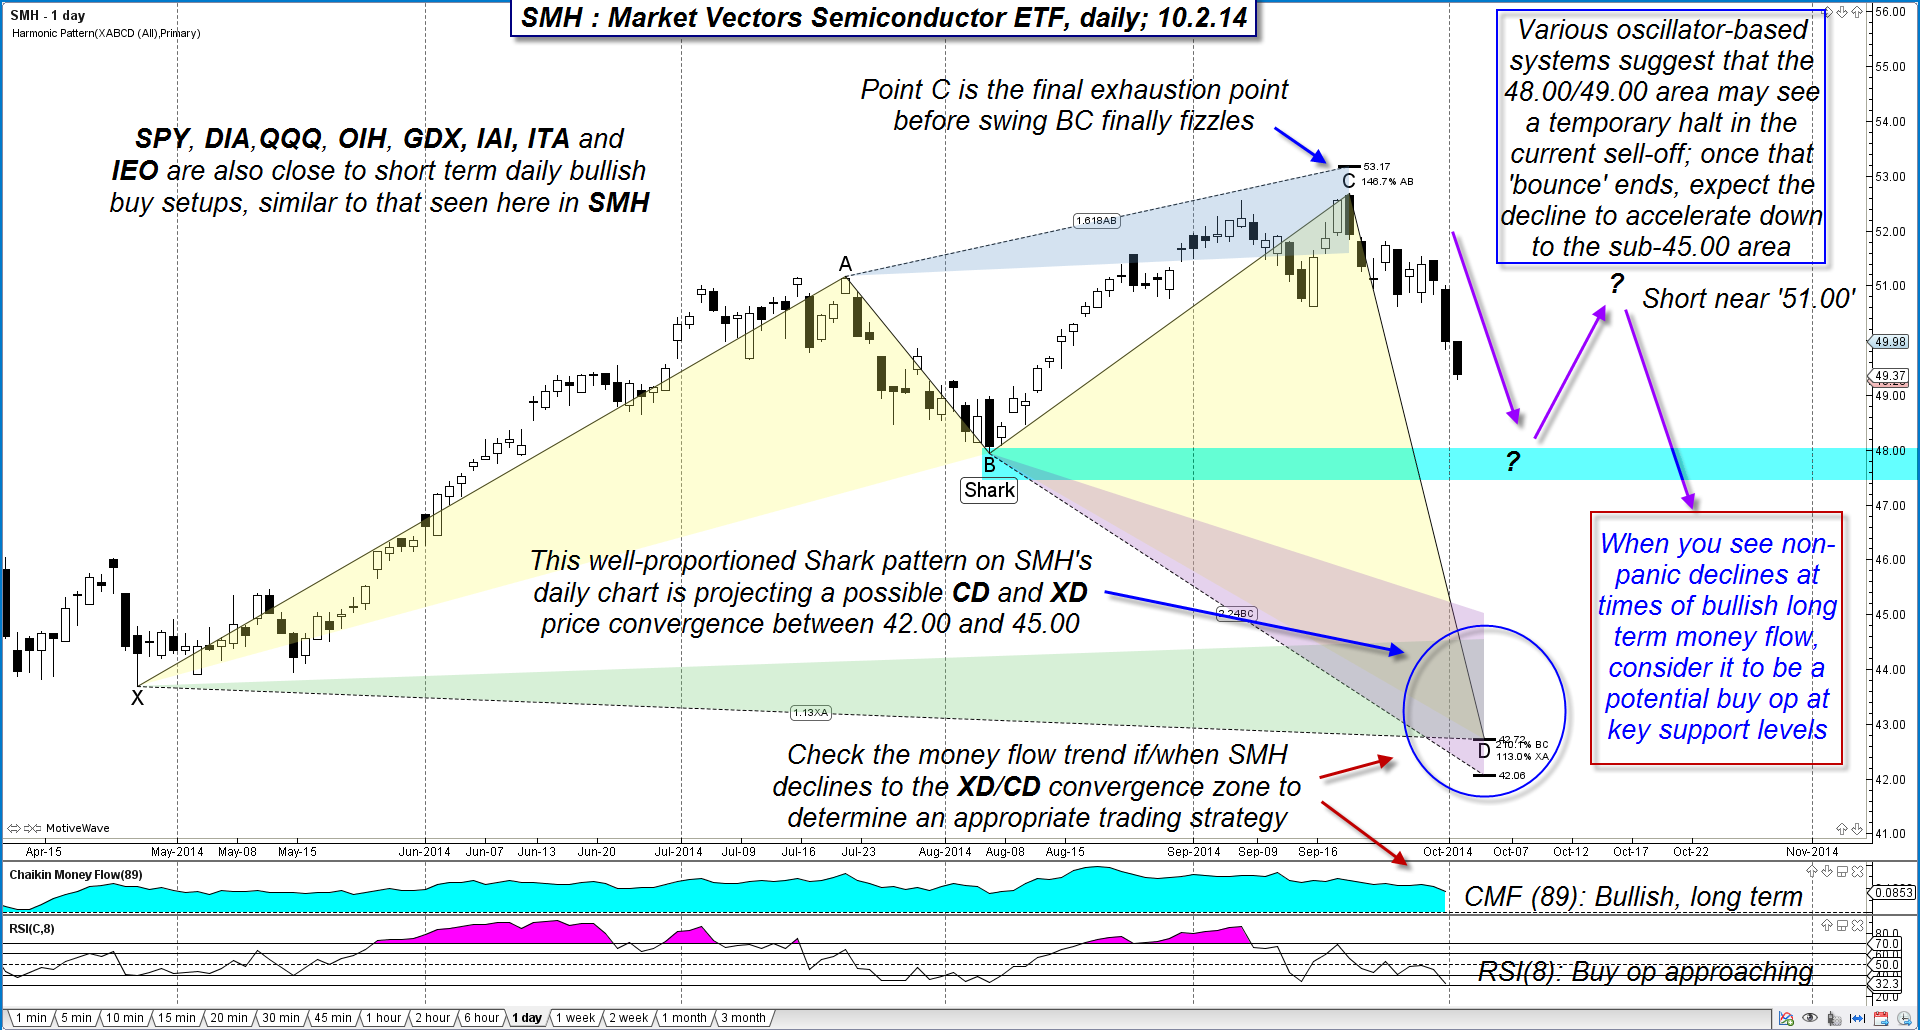
| Shares of the Market Vectors Semiconductors ETF (SMH) have sold off by nearly 7% since mid-September 2014, but a tradable swing low is fast approaching. Here's a look at the daily chart (Figure 1) for SMH along with an idea on how to trade a bounce from near-term support before a high probability, deeper decline hits later in October 2014. |
|
| Figure 1. Market Vectors Semiconductor ETF (SMH) has sold off sharply during the past two weeks but is anticipated to stage a short-term relief rally between 48.00 and 49.00 before making an even larger scale decline toward the 42.00-45.00 price zone. |
| Graphic provided by: MotiveWave.com. |
| |
| Harmonic price patterns occur on all time frames across all freely traded markets; some patterns have greater probability than others and no two are exactly alike. You can learn to visually identify them or use software to perform the scanning for you, but you are the final arbiter as to which patterns: 1. Offer the highest probability. 2. Are in agreement with market structure. 3. Are setting up trade entries that go with the famed 'line of least resistance.' 4. Have appeared many times in the past, with most resulting in a potentially profitable swing move. The harmonic pattern here is called a Shark and one of the key tip-offs is that swing BC is essentially a relatively weak swing, unable to rally as hard as swing XA; the MotiveWave software automatically scanned for this pattern, one that is already beginning to take form in SMH. Obviously a trader needs an entry exit method to utilize such a pattern and a set of rational expectations: 1. Since the projected swing CD is a leading indicator, one way to engage the dynamics here would be to wait for SMH to drop into support (anticipated between 48.00 and 49.00 per several of my systems) and to then bounce higher by 38% of the length of swing BC. This would set up a potential short entry zone near 50.50/51.00 and as long as you actually wait for valid confirmation of a bearish reversal, would offer an outstanding risk/reward ratio on a potential completion of swing CD. The stop loss would go at around 52.00; a short entry at 50.00, 50.50 and 51.00 — assuming all were filled and you were not stopped out — would yield a risk/reward ration of better than 3.6 to 1, assuming the minimum target of 45.00 for swing CD is reached. Obviously, you would need to use a trailing stop (try a pair of three- and seven-period exponential moving averages for an effective medium-term trailing stop, FYI), time your entries properly - using discretion and trader instinct if necessary - and would need to keep your account risk modest at 1-2%, but overall this could be a great short setup as long as SMH and the major stock indexes move in these anticipated directions over the next four to eight weeks. 2. The second way to play this pattern involves more patience, since you'd want to see clear evidence that SMH had indeed found major support in the lower $40.00 area where the shaded price projection zones all overlap (circle). Once down to those levels, look for the following: A. Long-term Chaikin Money Flow (CMF)(89) at or above its zero line. B. ADX readings at unsustainable highs. C. Panic selling days with ultra high volume. D. Short ratio (days needed for shorts to fully cover their positions) steadily increasing. E. Signs of bullish reversal on the 30-, 60- and 120-minute time frames, with quick follow-through on the daily chart. F. Lots of bearish news headlines about the semiconductor group. |
|
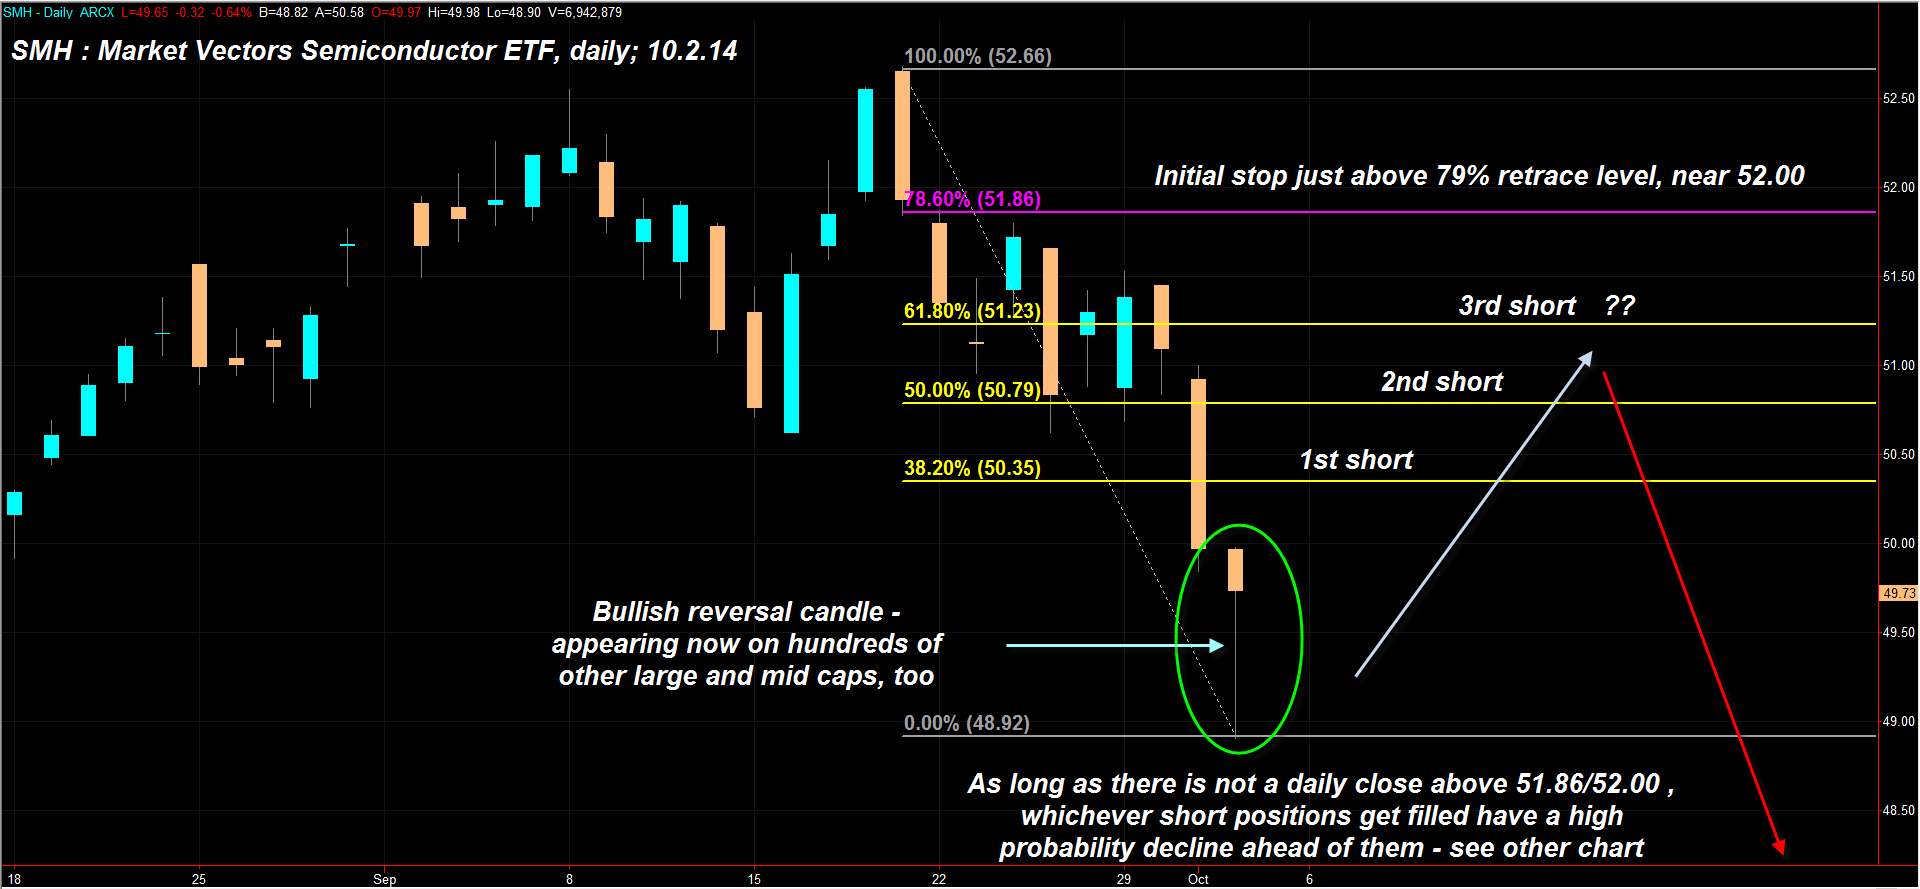
| Figure 2. SMH did indeed begin to reverse in the afternoon session on October 2, 2014, as did hundreds of other stocks; the three Fibonacci retracement lines provide logical short entry points for skilled short sellers. |
| Graphic provided by: TradeStation. |
| |
| If you see many of these factors in play should SMH make a rapid decline into the XD/CD convergence zone on the chart, SMH is ripe for a bullish reversal. Wait for confirmation of the reversal to occur first before jumping in with a modest amount, and don't attempt to chase lower prices, hoping to average down (bad idea: been there, done that and survived). Then let the ETF prove itself, perhaps putting on a bigger long position after the first 38-50% pullback from the ultimate CD swing low. Reversal trades like this can be powerful, but you still need to build size slowly and to maintain strict risk control at all times. Your main advantage here is that you already know in advance where the high probability turning zone is — sometimes weeks in advance — and you can time earlier entries with lower risk than the typical retail trader who is almost always the last one to the party — after the smart money has already made sizeable gains. Trade wisely until we meet here again. |
Freelance financial markets writer and online publisher of the Trendzetterz.com S&P 500 Weekly Forecast service.
| Title: | Market consultant and writer |
| Company: | Trendzetterz |
| Address: | 81 Hickory Hollow Drive |
| Crossville, TN 38555 | |
| Phone # for sales: | 904-303-4814 |
| Website: | trendzetterz.com |
| E-mail address: | support@trendzetterz.com |
Traders' Resource Links | |
| Trendzetterz has not added any product or service information to TRADERS' RESOURCE. | |
Click here for more information about our publications!
PRINT THIS ARTICLE

Request Information From Our Sponsors
- StockCharts.com, Inc.
- Candle Patterns
- Candlestick Charting Explained
- Intermarket Technical Analysis
- John Murphy on Chart Analysis
- John Murphy's Chart Pattern Recognition
- John Murphy's Market Message
- MurphyExplainsMarketAnalysis-Intermarket Analysis
- MurphyExplainsMarketAnalysis-Visual Analysis
- StockCharts.com
- Technical Analysis of the Financial Markets
- The Visual Investor
- VectorVest, Inc.
- Executive Premier Workshop
- One-Day Options Course
- OptionsPro
- Retirement Income Workshop
- Sure-Fire Trading Systems (VectorVest, Inc.)
- Trading as a Business Workshop
- VectorVest 7 EOD
- VectorVest 7 RealTime/IntraDay
- VectorVest AutoTester
- VectorVest Educational Services
- VectorVest OnLine
- VectorVest Options Analyzer
- VectorVest ProGraphics v6.0
- VectorVest ProTrader 7
- VectorVest RealTime Derby Tool
- VectorVest Simulator
- VectorVest Variator
- VectorVest Watchdog