

HOT TOPICS LIST
- MACD
- Fibonacci
- RSI
- Gann
- ADXR
- Stochastics
- Volume
- Triangles
- Futures
- Cycles
- Volatility
- ZIGZAG
- MESA
- Retracement
- Aroon
INDICATORS LIST
LIST OF TOPICS
PRINT THIS ARTICLE
by Thomas Bopp
McDonald's is no longer the darling stock it once was, although it continues to pay dividends. The reason for its loss of luster could be the competition in the cheap and fast dining arena.
Position: N/A
Thomas Bopp
Thomas Bopp has more than 25 years experience in all kinds of trading. He mainly trades options on the short-side based on his own unique trading systems. He is also responsible for a German and Spanish free daily market newsletter, which covers the S&P 500, Ibex 35, DAX and German Bund-Future.
PRINT THIS ARTICLE
McDonald's - Fast Food Or Fast Move?
10/06/14 04:43:45 PMby Thomas Bopp
McDonald's is no longer the darling stock it once was, although it continues to pay dividends. The reason for its loss of luster could be the competition in the cheap and fast dining arena.
Position: N/A
| At one time, traveling through the US, vacationers had only Burger King, McDonalds, and Kentucky Fried Chicken as their eating options. Because of more competition from other similar eateries throughout rural America, McDonald's profit margins have decreased. In the last few months, the burger company brought no joy to share holders. McDonald's (MCD) has seen its stock price decline as you can see from its price chart. |
|
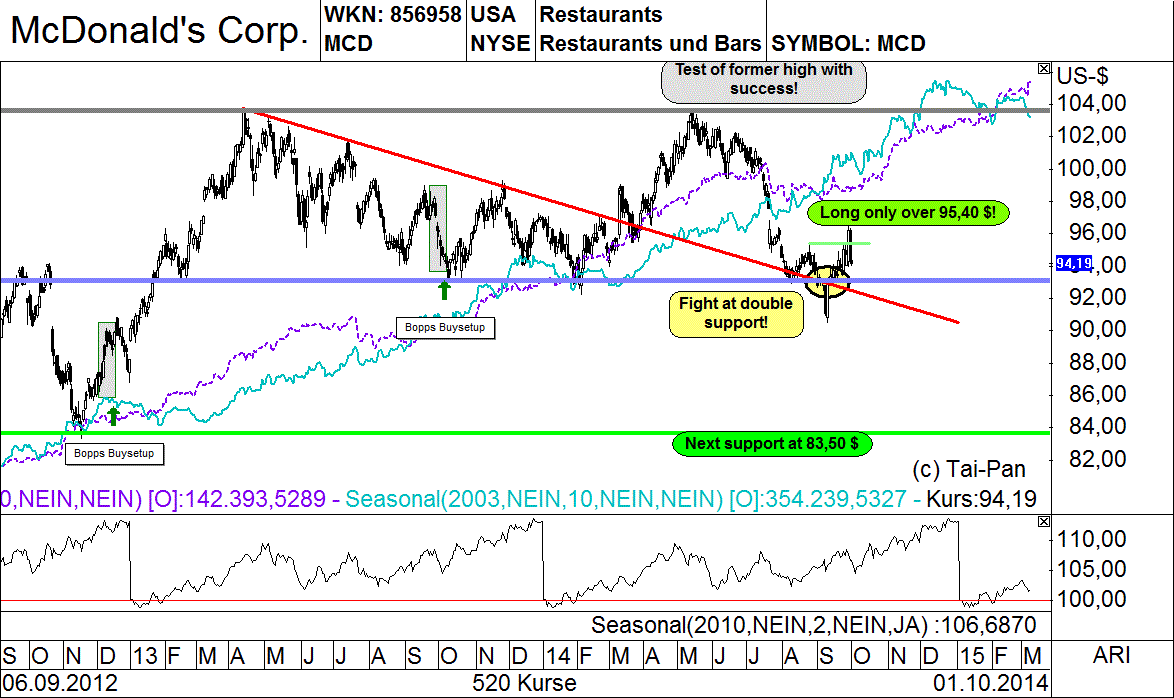
| Figure 1. McDonald's has defended its support-zone. Further losses are only likely if the stock price falls under $90. The minimum goal should be $83,50. Going long should only be considered if the stock closes above $95.40 for two consecutive days. |
| Graphic provided by: www.lp-software.de. |
| |
| In Figure 1 you see the long-term chart of MCD which shows that the stock price has defended a double support. If MCD falls back under the red downtrend line, the situation would be very bearish. Technical analysts will refer to this newly given sell-signal as an M-formation. The price target would be the lower support at $83.50. There is only one problem with this kind of outcome: such a movement is not supported by the seasonal lines that are displayed on the chart in three different forms. Two additional lines and an indicator window are added. The turquoise seasonal line is calculated using data from the past 10 years. The purple seasonal line is calculated using data from 1980. The indicator window is calculated using data from the last three years. All three lines point to the upside. Therefore, a short-position should only be opened if the stock trades under $90. If that happens, the stock is likely to move lower due to additional selling and would go against the seasonal pattern. However, if the stock price rises above $95.40 for two days, the positive seasonal pattern could still be in play. This would show the strength of the support level and the stock could rise further. |
|
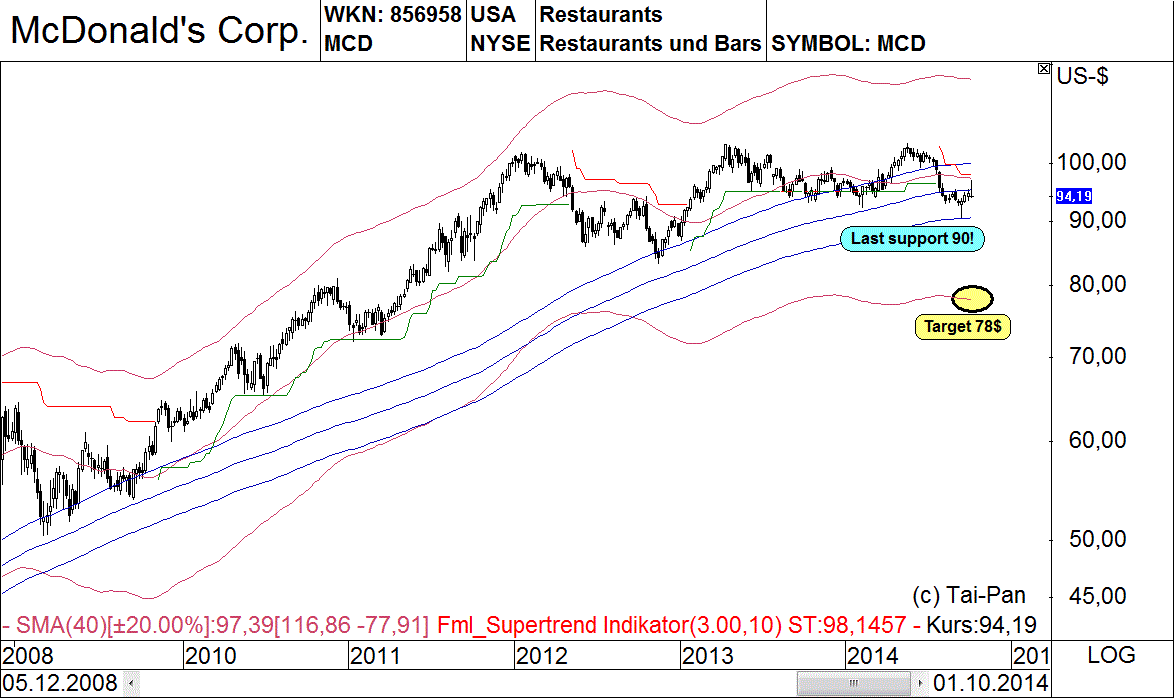
| Figure 2. The lower blue 800-day envelope should be used as a short entry. You can expect a strong sell signal if this band is crossed from above. The target is in the area of $78. |
| Graphic provided by: www.lp-software.de. |
| |
| In Figure 2 you see an envelope chart. The blue envelopes are calculated based on closing prices of the last 800 days, or 160 weeks. The low blue envelope was touched in the last few days and was confirmed as a strong support. The move is likely to accelerate if the envelope support occurs again after prices break through. I have found that these envelopes serve well as support & resistance lines. A new low in this timeframe opens downward potential until $78. At that point you find another envelope based on a 200-day moving average with a deviation of 20 percent. |
|
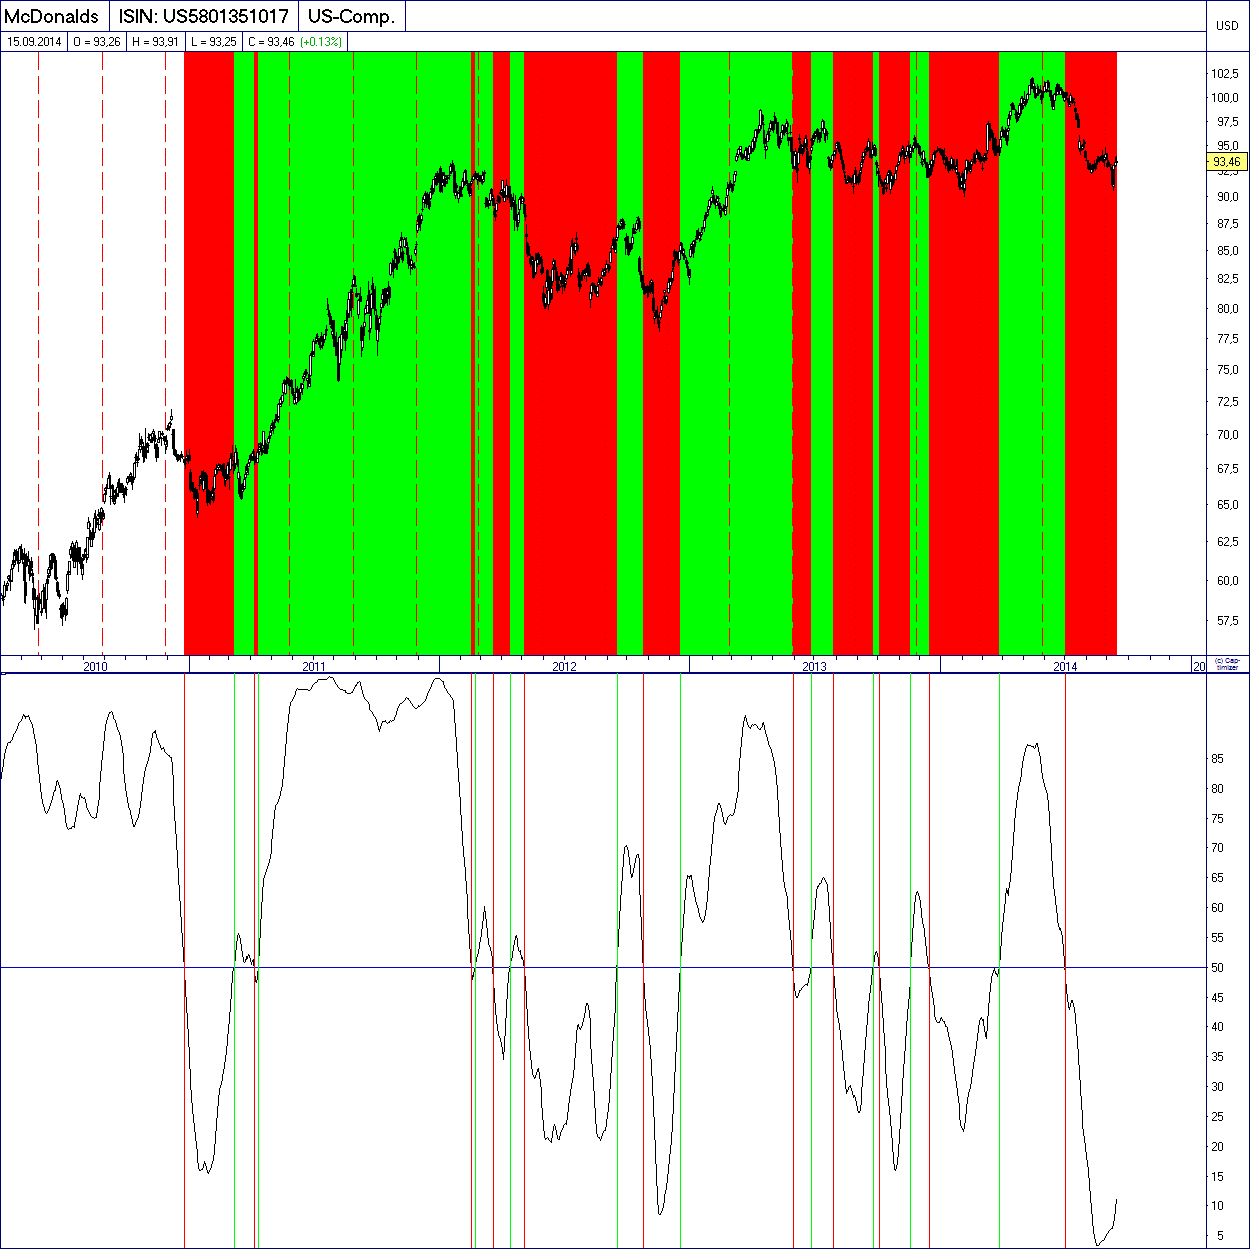
| Figure 3. The long-term picture shows buy and sell signals on the basis of a ranking indicator. The stock generated a short-signal several months ago. |
| Graphic provided by: www.captimizer.de. |
| |
| Let's take a look at the ranking indicator which is developed on the basis of the relative strength. The ranking indicator compares MCD with 4200 stocks, traded on US exchanges. The indicator is averaged over a period of 20 days. If it is above 50%, it means the stock is in the first half of those 4200 stocks and therefore a favorite among investors. The red and green marked areas in the price chart show where the indicator crosses the 50% band. MCD belongs to the weakest 10% of the US stock universe. You're better off waiting to see what the stock will do in the coming days. One of the entry levels can be used to go long or short. Until then, the best you can do is keep an eye on it. |
Thomas Bopp has more than 25 years experience in all kinds of trading. He mainly trades options on the short-side based on his own unique trading systems. He is also responsible for a German and Spanish free daily market newsletter, which covers the S&P 500, Ibex 35, DAX and German Bund-Future.
| Title: | Freelance trader and analyst |
| Company: | Bopp's Financial Market Studies |
| Address: | Eichendorffweg 6 |
| 61194 Niddatal, Germany, 61194 | |
| Phone # for sales: | +49 60347961 |
| E-mail address: | webmaster@zyklusanalyst.de |
Traders' Resource Links | |
| Bopp's Financial Market Studies has not added any product or service information to TRADERS' RESOURCE. | |
Click here for more information about our publications!
PRINT THIS ARTICLE

Request Information From Our Sponsors
- StockCharts.com, Inc.
- Candle Patterns
- Candlestick Charting Explained
- Intermarket Technical Analysis
- John Murphy on Chart Analysis
- John Murphy's Chart Pattern Recognition
- John Murphy's Market Message
- MurphyExplainsMarketAnalysis-Intermarket Analysis
- MurphyExplainsMarketAnalysis-Visual Analysis
- StockCharts.com
- Technical Analysis of the Financial Markets
- The Visual Investor
- VectorVest, Inc.
- Executive Premier Workshop
- One-Day Options Course
- OptionsPro
- Retirement Income Workshop
- Sure-Fire Trading Systems (VectorVest, Inc.)
- Trading as a Business Workshop
- VectorVest 7 EOD
- VectorVest 7 RealTime/IntraDay
- VectorVest AutoTester
- VectorVest Educational Services
- VectorVest OnLine
- VectorVest Options Analyzer
- VectorVest ProGraphics v6.0
- VectorVest ProTrader 7
- VectorVest RealTime Derby Tool
- VectorVest Simulator
- VectorVest Variator
- VectorVest Watchdog