HOT TOPICS LIST
- MACD
- Fibonacci
- RSI
- Gann
- ADXR
- Stochastics
- Volume
- Triangles
- Futures
- Cycles
- Volatility
- ZIGZAG
- MESA
- Retracement
- Aroon
INDICATORS LIST
LIST OF TOPICS
PRINT THIS ARTICLE
by Matt Blackman
While large-cap stocks have continued their merry march higher, the same can't be said for other sectors, especially the high-yield bond market. What implications does this have for the stock rally?
Position: N/A
Matt Blackman
Matt Blackman is a full-time technical and financial writer and trader. He produces corporate and financial newsletters, and assists clients in getting published in the mainstream media. He is the host of TradeSystemGuru.com. Matt has earned the Chartered Market Technician (CMT) designation. Find out what stocks and futures Matt is watching on Twitter at www.twitter.com/RatioTrade
PRINT THIS ARTICLE
BOND & INTEREST RATE
What Does The Junk Bond Sell-Off Mean For Stocks Going Forward?
10/02/14 01:41:00 PMby Matt Blackman
While large-cap stocks have continued their merry march higher, the same can't be said for other sectors, especially the high-yield bond market. What implications does this have for the stock rally?
Position: N/A
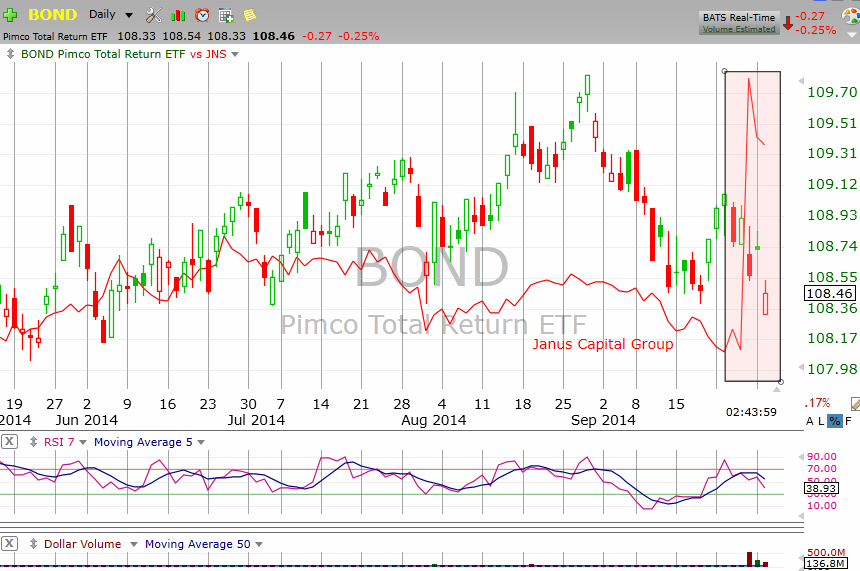
| Bill Gross's September 26th departure from Pimco to Janus Capital Group had a significant impact not only on the price of Pimco ETFs but on the bond market as well (see Figure 1). But the move was only the latest in a string of challenges to hit bonds, especially those of the junk or high-yield variety. There are many reasons why this market has been hit hard — a better than expected Q2 GDP report and a reduction in stimulus from the Federal Reserve — both of which investors believe will put upward pressure on interest rates. This has been triggering $2.7 billion in junk bond ETF sales since late June according to Bloomberg. |

|
| Figure 1 – Daily chart showing the effect of the Bill Gross departure from Pimco and move to Janus Capital (vertical rectangle). But the downtrend started weeks before the move. |
| Graphic provided by: TC2000.com. |
| |
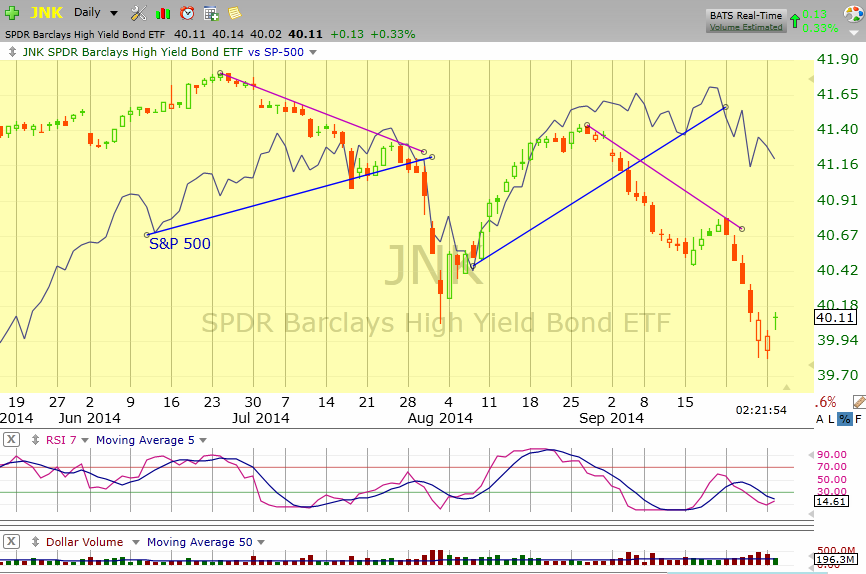
| But what is perhaps more interesting is that rate worries seem to have bypassed stock investors almost altogether at least as far as the S&P 500 is concerned (see Figure 2). As you can see, the last two corrections in bonds were followed by a correction in stocks approximately two to three weeks later but more importantly, while the overall trend in bonds is now down, the same can't be said for stocks. |

|
| Figure 2 – Daily chart comparing the Barclays High Yield Bond ETF (JNK) and the S&P 500 (blue) since May. Note what happened to stocks in the weeks after a bond sell-off. |
| Graphic provided by: TC2000.com. |
| |
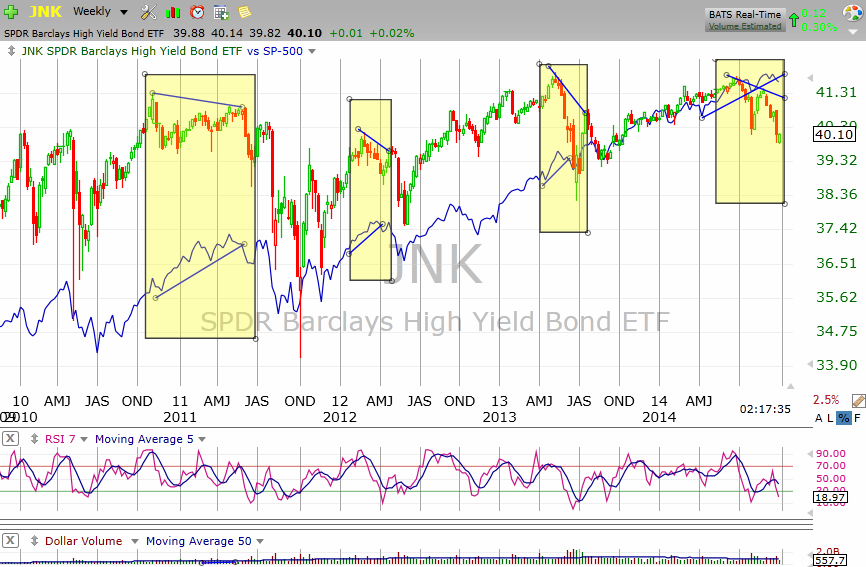
| Figure 3 shows the effect on a weekly chart. The first bond sell-off began months before stocks in 2010 but each subsequent stock sell-off has hit stocks more quickly; that is until the latest sell-off which began in June 2014. Since then, bond prices have been in a downtrend while stocks have continued to rally higher after a brief sell-off in August. |

|
| Figure 3 – Weekly chart showing the last four bond sell-offs since 2010 and impact on stocks. |
| Graphic provided by: TC2000.com. |
| |
| As we learned the hard way from the 2007-2008 financial crisis, it is possible to find a modicum of protection by diversifying in different asset classes in normal markets but when the big correction hits, the correlation across asset classes snaps to 100%. Presently high-yield bonds and small cap stocks appear to be warning us that another correction could be just around the corner. |
| SUGGESTED READING: Junk Bonds: Are We at the End of the Credit Cycle - Video |
Matt Blackman is a full-time technical and financial writer and trader. He produces corporate and financial newsletters, and assists clients in getting published in the mainstream media. He is the host of TradeSystemGuru.com. Matt has earned the Chartered Market Technician (CMT) designation. Find out what stocks and futures Matt is watching on Twitter at www.twitter.com/RatioTrade
| Company: | TradeSystemGuru.com |
| Address: | Box 2589 |
| Garibaldi Highlands, BC Canada | |
| Phone # for sales: | 604-898-9069 |
| Fax: | 604-898-9069 |
| Website: | www.tradesystemguru.com |
| E-mail address: | indextradermb@gmail.com |
Traders' Resource Links | |
| TradeSystemGuru.com has not added any product or service information to TRADERS' RESOURCE. | |
Click here for more information about our publications!
PRINT THIS ARTICLE

Request Information From Our Sponsors
- VectorVest, Inc.
- Executive Premier Workshop
- One-Day Options Course
- OptionsPro
- Retirement Income Workshop
- Sure-Fire Trading Systems (VectorVest, Inc.)
- Trading as a Business Workshop
- VectorVest 7 EOD
- VectorVest 7 RealTime/IntraDay
- VectorVest AutoTester
- VectorVest Educational Services
- VectorVest OnLine
- VectorVest Options Analyzer
- VectorVest ProGraphics v6.0
- VectorVest ProTrader 7
- VectorVest RealTime Derby Tool
- VectorVest Simulator
- VectorVest Variator
- VectorVest Watchdog
- StockCharts.com, Inc.
- Candle Patterns
- Candlestick Charting Explained
- Intermarket Technical Analysis
- John Murphy on Chart Analysis
- John Murphy's Chart Pattern Recognition
- John Murphy's Market Message
- MurphyExplainsMarketAnalysis-Intermarket Analysis
- MurphyExplainsMarketAnalysis-Visual Analysis
- StockCharts.com
- Technical Analysis of the Financial Markets
- The Visual Investor
