

HOT TOPICS LIST
- MACD
- Fibonacci
- RSI
- Gann
- ADXR
- Stochastics
- Volume
- Triangles
- Futures
- Cycles
- Volatility
- ZIGZAG
- MESA
- Retracement
- Aroon
INDICATORS LIST
LIST OF TOPICS
PRINT THIS ARTICLE
by Donald W. Pendergast, Jr.
Shares of Freeport McMoran Copper And Gold are trading just above a high probability support area at a time of bullish money flows.
Position: N/A
Donald W. Pendergast, Jr.
Freelance financial markets writer and online publisher of the Trendzetterz.com S&P 500 Weekly Forecast service.
PRINT THIS ARTICLE
FIBONACCI
FCX: Major Support And Strong Money Flow
10/02/14 01:36:26 PMby Donald W. Pendergast, Jr.
Shares of Freeport McMoran Copper And Gold are trading just above a high probability support area at a time of bullish money flows.
Position: N/A
| Swing traders looking to improve their performance as they trade large cap stocks with a proven, visually verified history of sustained swing/trend moves would do well to add a key long-term money flow indicator to their daily/weekly analysis routines; doing so can help them identify higher probability entries — and sometimes even logical exit points. Here's a closer look at Freeport McMoran's (FCX) daily chart at a time when a key reversal zone is at hand even as its long-term money flows remain incredibly bullish (Figure 1). |
|
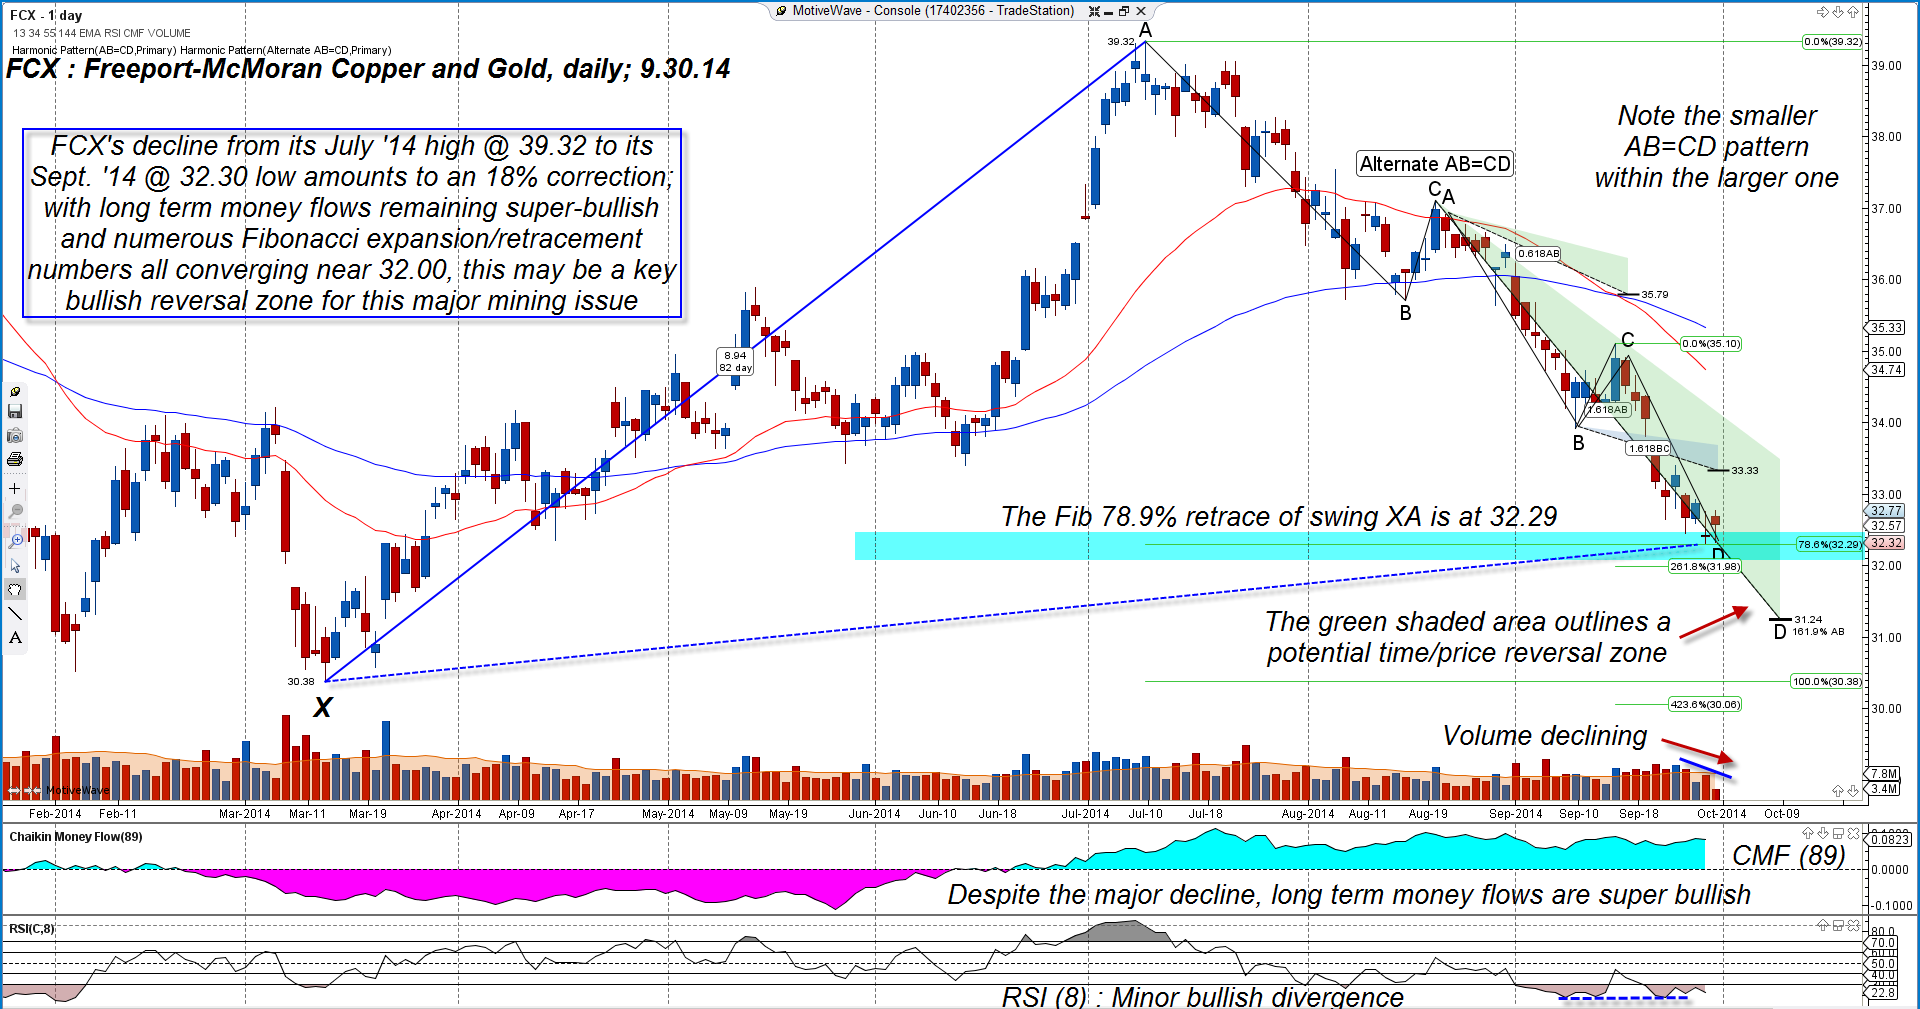
| Figure 1. Freeport McMoran Copper And Gold (FCX): Multiple Fibonacci swing/retracement ratios all converge near 32.00 in this major metals mining stock; note the extremely bullish money flows throughout the recent decline. |
| Graphic provided by: MotiveWave.com. |
| |
| There are a variety of methods that traders rely on to help identify high probability reversal zones, such as: 1. Bollinger Bands 2. RSI 3. CCI 4. Keltner bands 5. Significant swing highs/lows 6. Elliott Wave tools 6. Fibonacci expansion/retracement ratios 7. Price cycles 8. MACD 9. Money flow Of the nine methods listed above, the best leading indicators for identifying key reversal zones are Elliott Wave (EW) and Fibonacci expansion/retracement; these two specialized fields of technical analysis work hand in hand and can often time reversals more accurately than the other six tools by themselves. However, when the Bollingers, Keltners, price cycles and momentum oscillators all come into general agreement with EW and Fib projections, a very powerful reversal methodology can be constructed, one that works on most liquid stocks that make regular swing/trending thrusts. On the chart in Figure 1, the EW counts have been hidden to make the chart easier to read, but four important Fib ratios coming into agreement near the 32.00 level are clearly evident: a. Major swing AB is projected to terminate at or before 31.24. b Minor swing AB has already reached 89% the length of minor swing AB at 31.98. c. Minor swing BC is projected to terminate at or before 32.29. d. Incredibly, the Fib 79% retracement of swing XA also occurs at 32.29. Traders familiar with harmonic patterns already know that when you have four or more harmonic-related Fib numbers in agreement within a close time/price window that the probability for a strong reversal is very high. What they may not realize is that when long-term money flows remain ultra-bullish like this — at the time such a harmonic convergence occurs after a sizable correction — well, that's even more literal fuel under the stock that can help launch a powerful bullish reversal. Lastly, a bullish divergence with price by the eight-period RSI (bottom panel of chart) also depicts another potential confirmation of an in-process or upcoming reversal for FCX. |
|
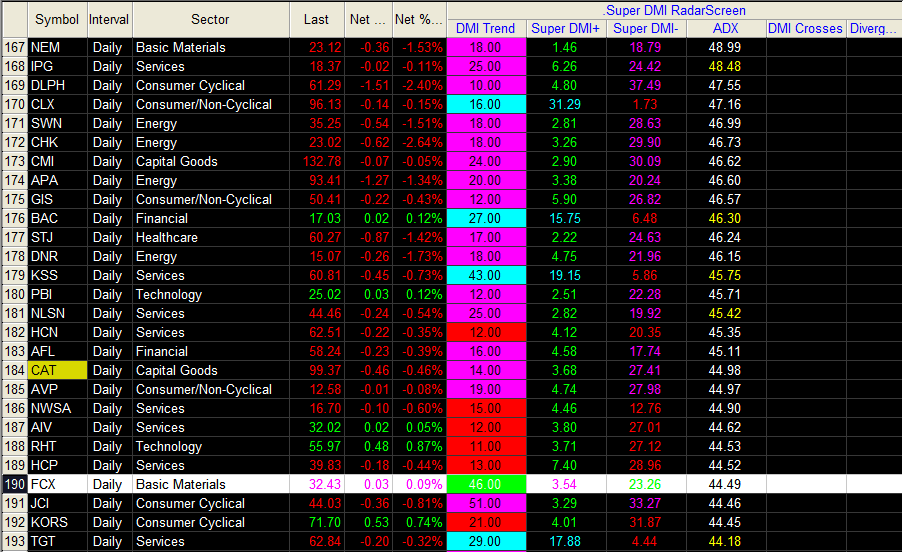
| Figure 2. FCX still has a high ADX (average directional movement) reading, but note that the stock is actually trading higher on September 30, 2014, unlike many other bearish, high-ADX S&P 500 issues. |
| Graphic provided by: TradeStation. |
| Graphic provided by: TradeStation RadarScreen/Fibozachi.com indicators. |
| |
| Identifying promising reversal candidates is one thing, but timing an entry requires some patience; since timing the exact low isn't possible, the next best thing is to wait for FCX to put in a reversal candle with a long tail and a higher close than that day's open and the previous day's close. If you see that you know the short-term momentum has shifted to the bulls and now you want to see the highest high of the previous (from the swing low candle) three trading sessions taken out on heavy volume. At that point, some kind of bullish reversal is underway and you need to consider getting onboard. Selling near-term, out-of-the-money puts is one of the easier ways to play a high probability reversal, especially if you like the idea of making regular base hits rather than trying to swing for the fences like a trend follower; selling a November 2014 FCX $31.00 put option looks great here — the bid/ask spread is good, daily time decay is $1 per day/per contract, and open interest is nearly 12,000 contracts. The big idea is to sell the put after the aforementioned reversal setup materializes and then hold the put until its price withers by half or more or for as long as FCX remains above $31.00. Time decay will quickly erode the value of the option, as will a powerful short covering rally, thus putting cash into your pocket. Keep your account risk at 1% or less and remember to trade wisely until we meet here again. |
Freelance financial markets writer and online publisher of the Trendzetterz.com S&P 500 Weekly Forecast service.
| Title: | Market consultant and writer |
| Company: | Trendzetterz |
| Address: | 81 Hickory Hollow Drive |
| Crossville, TN 38555 | |
| Phone # for sales: | 904-303-4814 |
| Website: | trendzetterz.com |
| E-mail address: | support@trendzetterz.com |
Traders' Resource Links | |
| Trendzetterz has not added any product or service information to TRADERS' RESOURCE. | |
Click here for more information about our publications!
Comments
Date:�10/05/14Rank:�5Comment:�
Date:�10/06/14Rank:�4Comment:�

Request Information From Our Sponsors
- StockCharts.com, Inc.
- Candle Patterns
- Candlestick Charting Explained
- Intermarket Technical Analysis
- John Murphy on Chart Analysis
- John Murphy's Chart Pattern Recognition
- John Murphy's Market Message
- MurphyExplainsMarketAnalysis-Intermarket Analysis
- MurphyExplainsMarketAnalysis-Visual Analysis
- StockCharts.com
- Technical Analysis of the Financial Markets
- The Visual Investor
- VectorVest, Inc.
- Executive Premier Workshop
- One-Day Options Course
- OptionsPro
- Retirement Income Workshop
- Sure-Fire Trading Systems (VectorVest, Inc.)
- Trading as a Business Workshop
- VectorVest 7 EOD
- VectorVest 7 RealTime/IntraDay
- VectorVest AutoTester
- VectorVest Educational Services
- VectorVest OnLine
- VectorVest Options Analyzer
- VectorVest ProGraphics v6.0
- VectorVest ProTrader 7
- VectorVest RealTime Derby Tool
- VectorVest Simulator
- VectorVest Variator
- VectorVest Watchdog