HOT TOPICS LIST
- MACD
- Fibonacci
- RSI
- Gann
- ADXR
- Stochastics
- Volume
- Triangles
- Futures
- Cycles
- Volatility
- ZIGZAG
- MESA
- Retracement
- Aroon
INDICATORS LIST
LIST OF TOPICS
PRINT THIS ARTICLE
by Koos van der Merwe
When the market falls, money moves from looking for growth to looking for income and security.
Position: Buy
Koos van der Merwe
Has been a technical analyst since 1969, and has worked as a futures and options trader with First Financial Futures in Johannesburg, South Africa.
PRINT THIS ARTICLE
TECHNICAL ANALYSIS
Looking For Income
10/01/14 03:30:16 PMby Koos van der Merwe
When the market falls, money moves from looking for growth to looking for income and security.
Position: Buy
| The Royal Bank of Scotland (RBS) has around 700 branches, mainly in Scotland though there are branches in many larger towns and cities throughout England and Wales. Before the recent independence referendum in Scotland, RBS stated that should Scotland achieve independence, the bank would move from Scotland to England. The share price fell on that announcement, but with the vote going in favor of remaining in the United Kingdom, the share price recovered. One should, however, never forget that the British Government took an 81% shareholding in the RBS Group following the 2007-2008 financial crises. Since the collapse of its share price from a high of $217, to a low of $2.90, the share price has been moving in a sideways range between $5 and $18. Investors, however, have found a degree of security in the Preference shares of the company which are paying a 6% plus yield. |

|
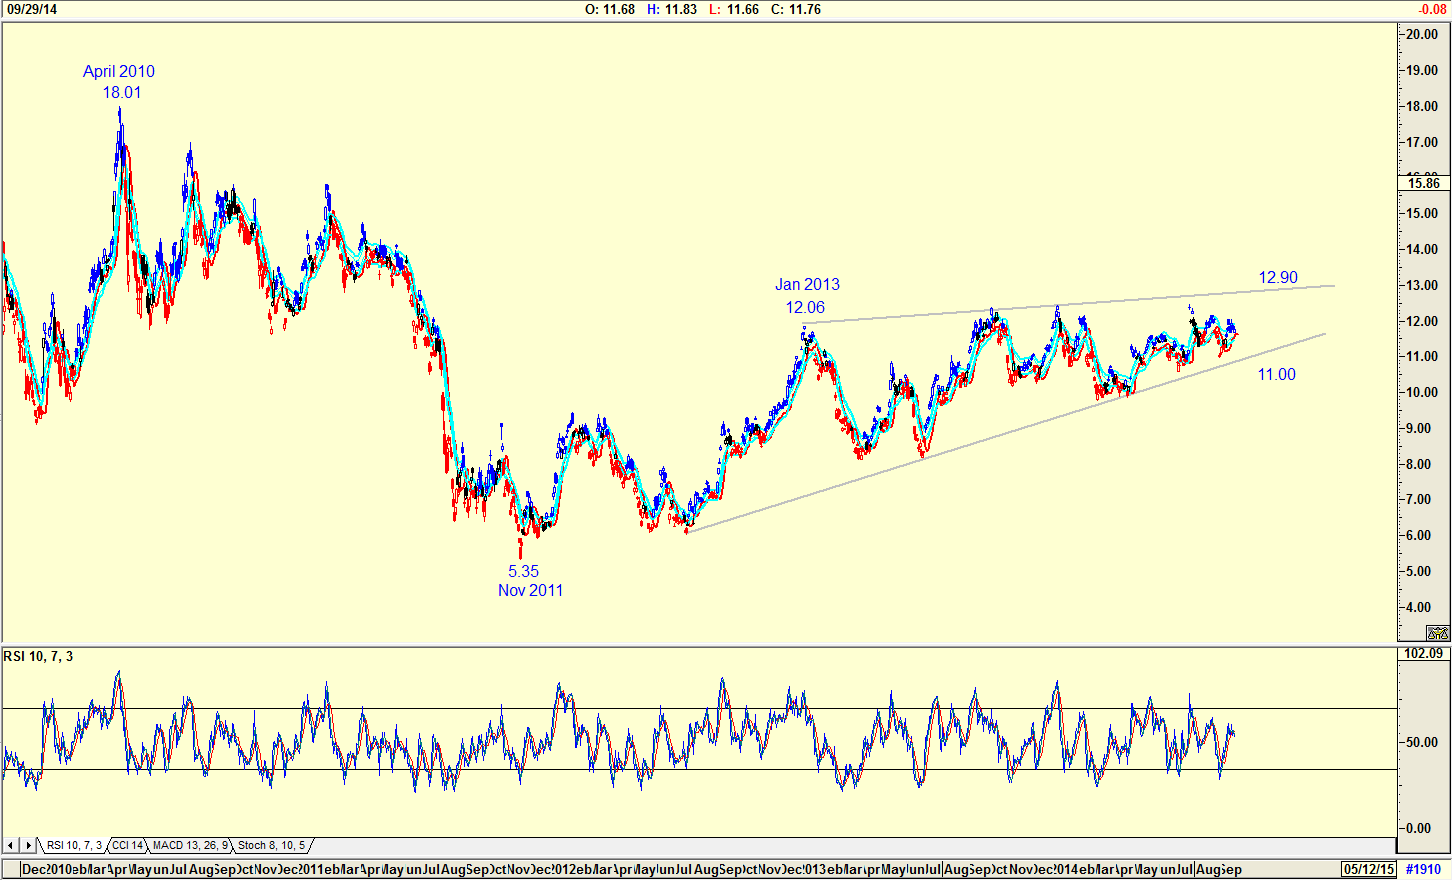
| Figure 1. Price Movement In Royal Bank Of Scotland Since April 2010. The stock seems to be forming a rising pattern with resistance at $12.90 and support at $11.00. |
| Graphic provided by: AdvancedGET. |
| |
| The chart in Figure 1 is a chart of RBS that shows how the share price has moved since April 2010. At present the share appears to be forming a rising pattern with resistance at $12.90 and support at $11.00. The relative strength index (RSI) is suggesting that the price should rise. |

|
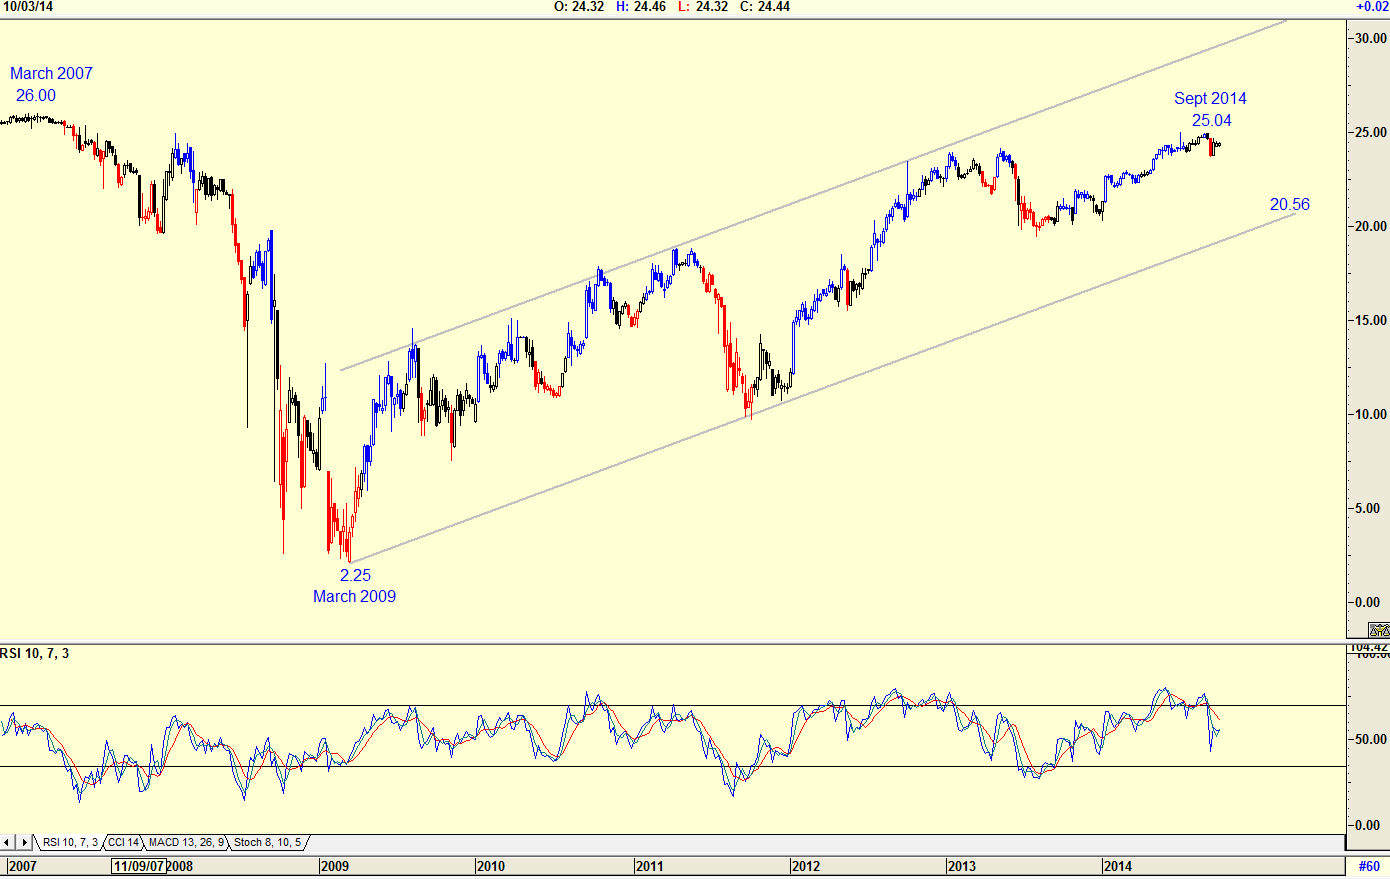
| Figure 2. Chart Of Royal Bank Of Scotland Preferred M. Price of the preferred stock fell from $26 in March 2007 to $2.25 by March 2009. Price recovered and is now trading close to $24.44. |
| Graphic provided by: AdvancedGET. |
| |
| The chart in Figure 2 is a weekly chart of the Preferred Share 'M' (RBS.M) and shows how the price of the preferred share fell from $26 in March 2007 to $2.25 by March 2009. The price then recovered and is presently trading at $24.44 and offering a yield of 6.5%. The RSI is suggesting that the price could fall possibly to the support line at $20.56. Should this happen, the yield offered will be greater. Of course there is the possibility that the RBS could reduce the yield of its preferred shares, the reason for the suggested drop. The Recent ex-dividend date was September 11, 2014 offering an annualized dividend of $1.60 paid quarterly with a yield of 6.56%. |

|
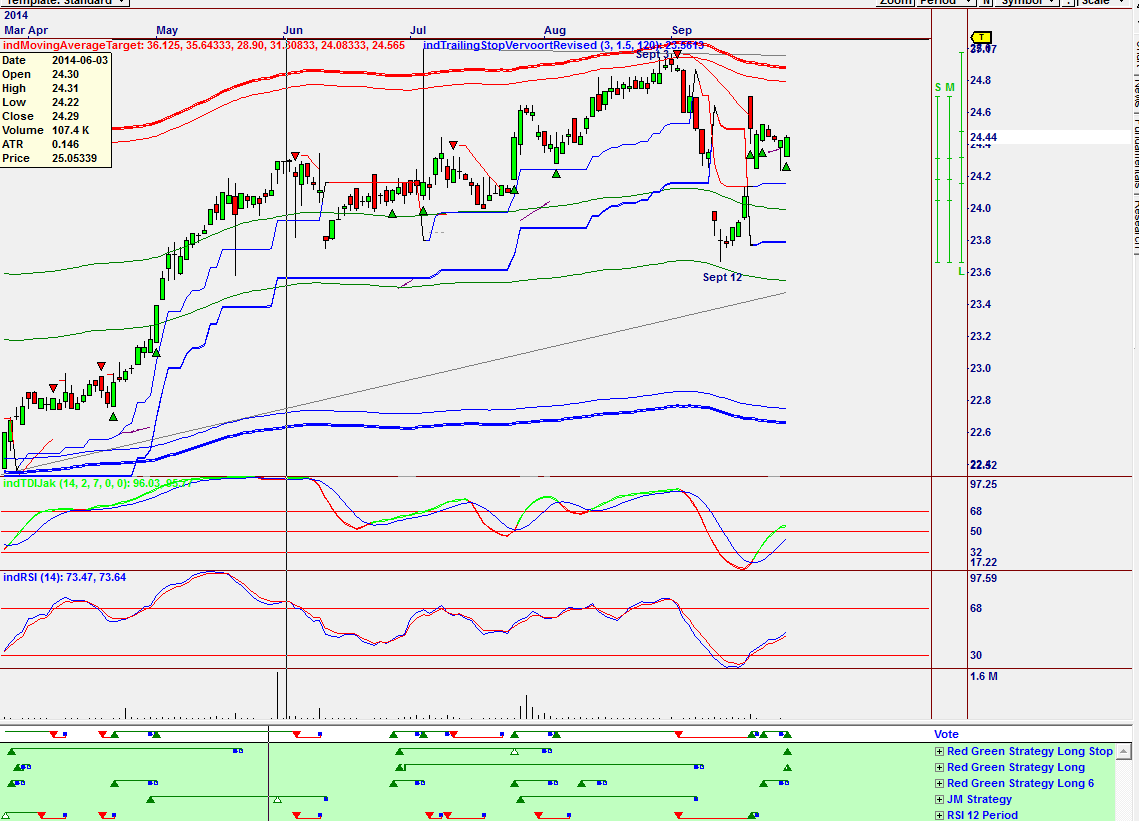
| Figure 3. Omnitrader Chart Of Royal Bank Of Scotland Preferred M. A buy signal was given on September 22, 2014. |
| Graphic provided by: Omnitrader. |
| |
| The chart in Figure 3 is a daily Omnitrader chart of RBS Preferred M showing how the preferred share dropped from September 3 to September 12, 2014. The Omnitrader chart gave a buy signal on September 22, 2014. The RSI indicator and the TDIJak indicators are suggesting buy signals. Yes, there are many RBS Preferred shares, all of them offering a yield above 6%. With the referendum of Scotland behind us putting money where the yield is good and the movement of the share pretty stagnant does look attractive. |
Has been a technical analyst since 1969, and has worked as a futures and options trader with First Financial Futures in Johannesburg, South Africa.
| Address: | 3256 West 24th Ave |
| Vancouver, BC | |
| Phone # for sales: | 6042634214 |
| E-mail address: | petroosp@gmail.com |
Click here for more information about our publications!
PRINT THIS ARTICLE

Request Information From Our Sponsors
- StockCharts.com, Inc.
- Candle Patterns
- Candlestick Charting Explained
- Intermarket Technical Analysis
- John Murphy on Chart Analysis
- John Murphy's Chart Pattern Recognition
- John Murphy's Market Message
- MurphyExplainsMarketAnalysis-Intermarket Analysis
- MurphyExplainsMarketAnalysis-Visual Analysis
- StockCharts.com
- Technical Analysis of the Financial Markets
- The Visual Investor
- VectorVest, Inc.
- Executive Premier Workshop
- One-Day Options Course
- OptionsPro
- Retirement Income Workshop
- Sure-Fire Trading Systems (VectorVest, Inc.)
- Trading as a Business Workshop
- VectorVest 7 EOD
- VectorVest 7 RealTime/IntraDay
- VectorVest AutoTester
- VectorVest Educational Services
- VectorVest OnLine
- VectorVest Options Analyzer
- VectorVest ProGraphics v6.0
- VectorVest ProTrader 7
- VectorVest RealTime Derby Tool
- VectorVest Simulator
- VectorVest Variator
- VectorVest Watchdog
