HOT TOPICS LIST
- MACD
- Fibonacci
- RSI
- Gann
- ADXR
- Stochastics
- Volume
- Triangles
- Futures
- Cycles
- Volatility
- ZIGZAG
- MESA
- Retracement
- Aroon
INDICATORS LIST
LIST OF TOPICS
PRINT THIS ARTICLE
by Koos van der Merwe
The share price of Nike (NKE) has gone up and up and up. Is the share price now due for a correction?
Position: Sell
Koos van der Merwe
Has been a technical analyst since 1969, and has worked as a futures and options trader with First Financial Futures in Johannesburg, South Africa.
PRINT THIS ARTICLE
GAPS
Is Nike Due For A Correction?
09/30/14 05:38:05 PMby Koos van der Merwe
The share price of Nike (NKE) has gone up and up and up. Is the share price now due for a correction?
Position: Sell
| When the share price of a company keeps rising without a major correction, surely it makes sense that caution should prevail? On September 25, 2014 Nike reported Fiscal 2015 first quarter results. Revenues were up 15%, diluted earnings per share up 27%, and worldwide futures orders up 11%. They reported that strong demand for their brands propelled revenue growth. At trading on September 26, 2014 at 11:51am, the share price was up 10.81% at $88.35. Is it time to take profits or should you keep holding? |

|
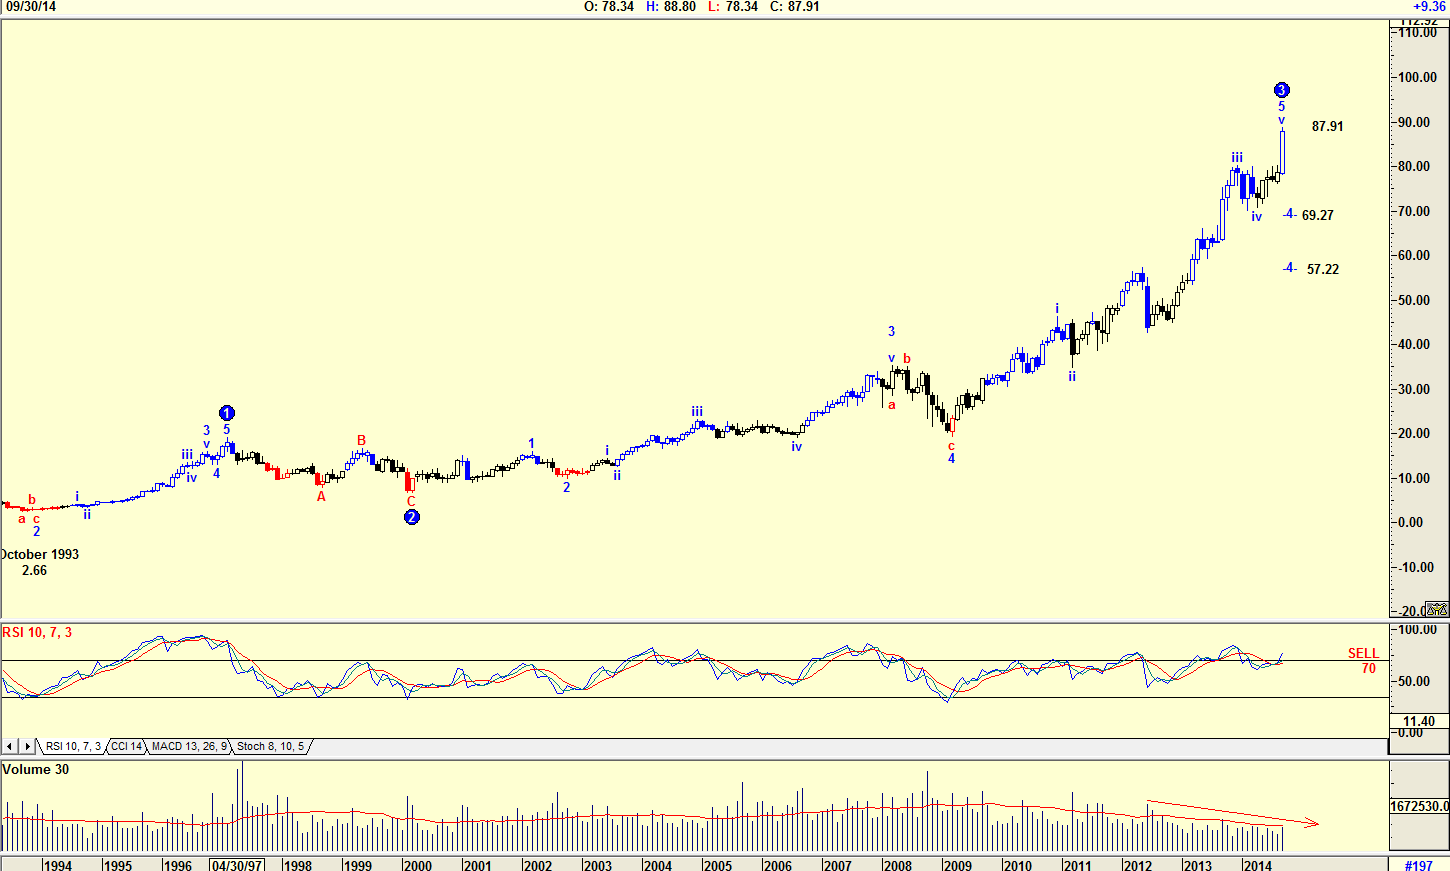
| Figure 1. Here you see a monthly chart of Nike (NKE) with an Elliott Wave count. |
| Graphic provided by: AdvancedGET. |
| |
| In the monthly chart in Figure 1 you see an Elliott Wave count showing how the share price rose from $2.66 in October 1993 to its current high of $87.91. The chart suggests that the share price is possibly completing a WAVE 3 and should start correcting to either $69.27 or $57.22 in a WAVE 4. This is confirmed by the relative strength index (RSI) which is in overbought territory. The RSI will trigger a sell signal when the price drops below the 70 horizontal line. Also notice how volume has declined as the price rose, a further suggestion that a correction could occur. A rising price plus falling volume suggests negativity. |

|
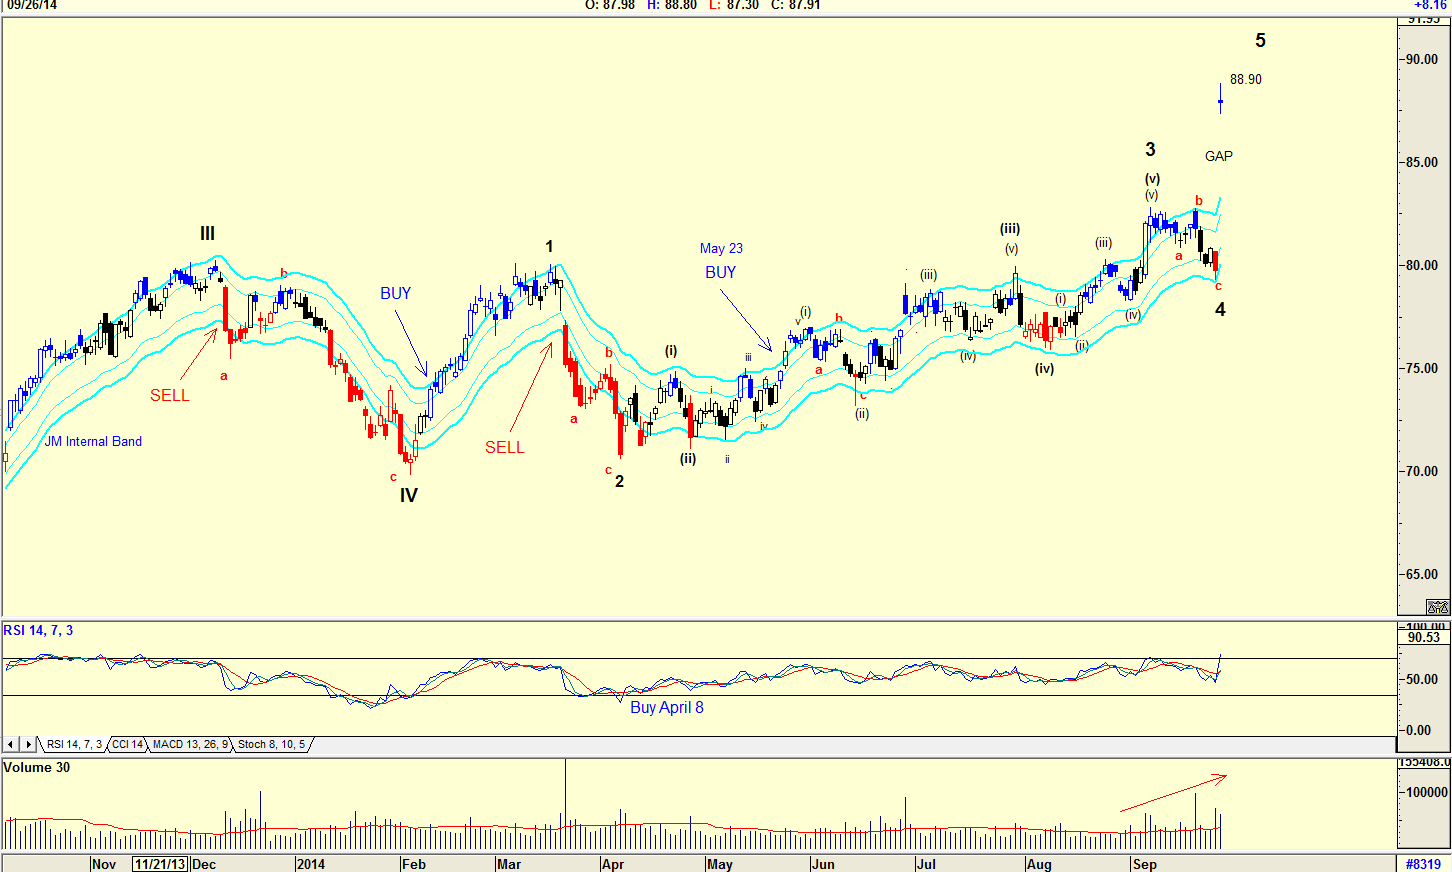
| Figure 2. Here you see a daily chart of NKE showing the price gap. |
| Graphic provided by: AdvancedGET. |
| |
| The chart in Figure 2 is a daily chart with an Elliott Wave count suggesting that the share price could well be in a Wave 5 and that a correction is due. The gap caused by the jump in the share price on September 26, 2014 also suggests that a correction could be due as the share price falls to 'fill the gap'. Note that the RSI is at overbought levels. Also note that volume rose as the share price fell, suggesting weakness. The rise to $88.90 is unexpected. A rise in a Wave 5 would have occurred, but the fall in the share price in Wave 4 suggested the rise into a wave 5 would be gradual. Finally, note the JM Internal Band where a buy signal has been triggered with the jump in price. A JM Internal band is a 15-period simple moving average offset by 2% positive and 2% negative. A buy signal is triggered when the price breaks above the upper band, and a sell signal when the price breaks below the lower band. A conservative investor who bought on the JM Internal Band buy signal of May 23, 2014 would be smiling. An active investor who bought on the RSI buy signal of April 8, 2014 would be laughing. Buying NKE at the present price would not be a wise decision. You should rather wait for the price to drop and fill the gap, and then analyze the charts and make a decision on whether to buy the stock or not. |
Has been a technical analyst since 1969, and has worked as a futures and options trader with First Financial Futures in Johannesburg, South Africa.
| Address: | 3256 West 24th Ave |
| Vancouver, BC | |
| Phone # for sales: | 6042634214 |
| E-mail address: | petroosp@gmail.com |
Click here for more information about our publications!
PRINT THIS ARTICLE

Request Information From Our Sponsors
- VectorVest, Inc.
- Executive Premier Workshop
- One-Day Options Course
- OptionsPro
- Retirement Income Workshop
- Sure-Fire Trading Systems (VectorVest, Inc.)
- Trading as a Business Workshop
- VectorVest 7 EOD
- VectorVest 7 RealTime/IntraDay
- VectorVest AutoTester
- VectorVest Educational Services
- VectorVest OnLine
- VectorVest Options Analyzer
- VectorVest ProGraphics v6.0
- VectorVest ProTrader 7
- VectorVest RealTime Derby Tool
- VectorVest Simulator
- VectorVest Variator
- VectorVest Watchdog
- StockCharts.com, Inc.
- Candle Patterns
- Candlestick Charting Explained
- Intermarket Technical Analysis
- John Murphy on Chart Analysis
- John Murphy's Chart Pattern Recognition
- John Murphy's Market Message
- MurphyExplainsMarketAnalysis-Intermarket Analysis
- MurphyExplainsMarketAnalysis-Visual Analysis
- StockCharts.com
- Technical Analysis of the Financial Markets
- The Visual Investor
