HOT TOPICS LIST
- MACD
- Fibonacci
- RSI
- Gann
- ADXR
- Stochastics
- Volume
- Triangles
- Futures
- Cycles
- Volatility
- ZIGZAG
- MESA
- Retracement
- Aroon
INDICATORS LIST
LIST OF TOPICS
PRINT THIS ARTICLE
by Donald W. Pendergast, Jr.
Shares of Diamond Offshore Drilling (DO) may be close to a sizable bounce as the stock approaches key support/swing termination levels.
Position: N/A
Donald W. Pendergast, Jr.
Freelance financial markets writer and online publisher of the Trendzetterz.com S&P 500 Weekly Forecast service.
PRINT THIS ARTICLE
REVERSAL
Diamond Offshore: Bullish Reversal Near
09/29/14 04:18:02 PMby Donald W. Pendergast, Jr.
Shares of Diamond Offshore Drilling (DO) may be close to a sizable bounce as the stock approaches key support/swing termination levels.
Position: N/A
| Now down by nearly 49% since making a major high in February 2013, shares of Diamond Offshore Drilling (DO) — along with several other major players in the oil services industry group — appear to be at or very near a significant bullish reversal zone. Here's a closer look now at DO's daily chart (Figure 1). |

|
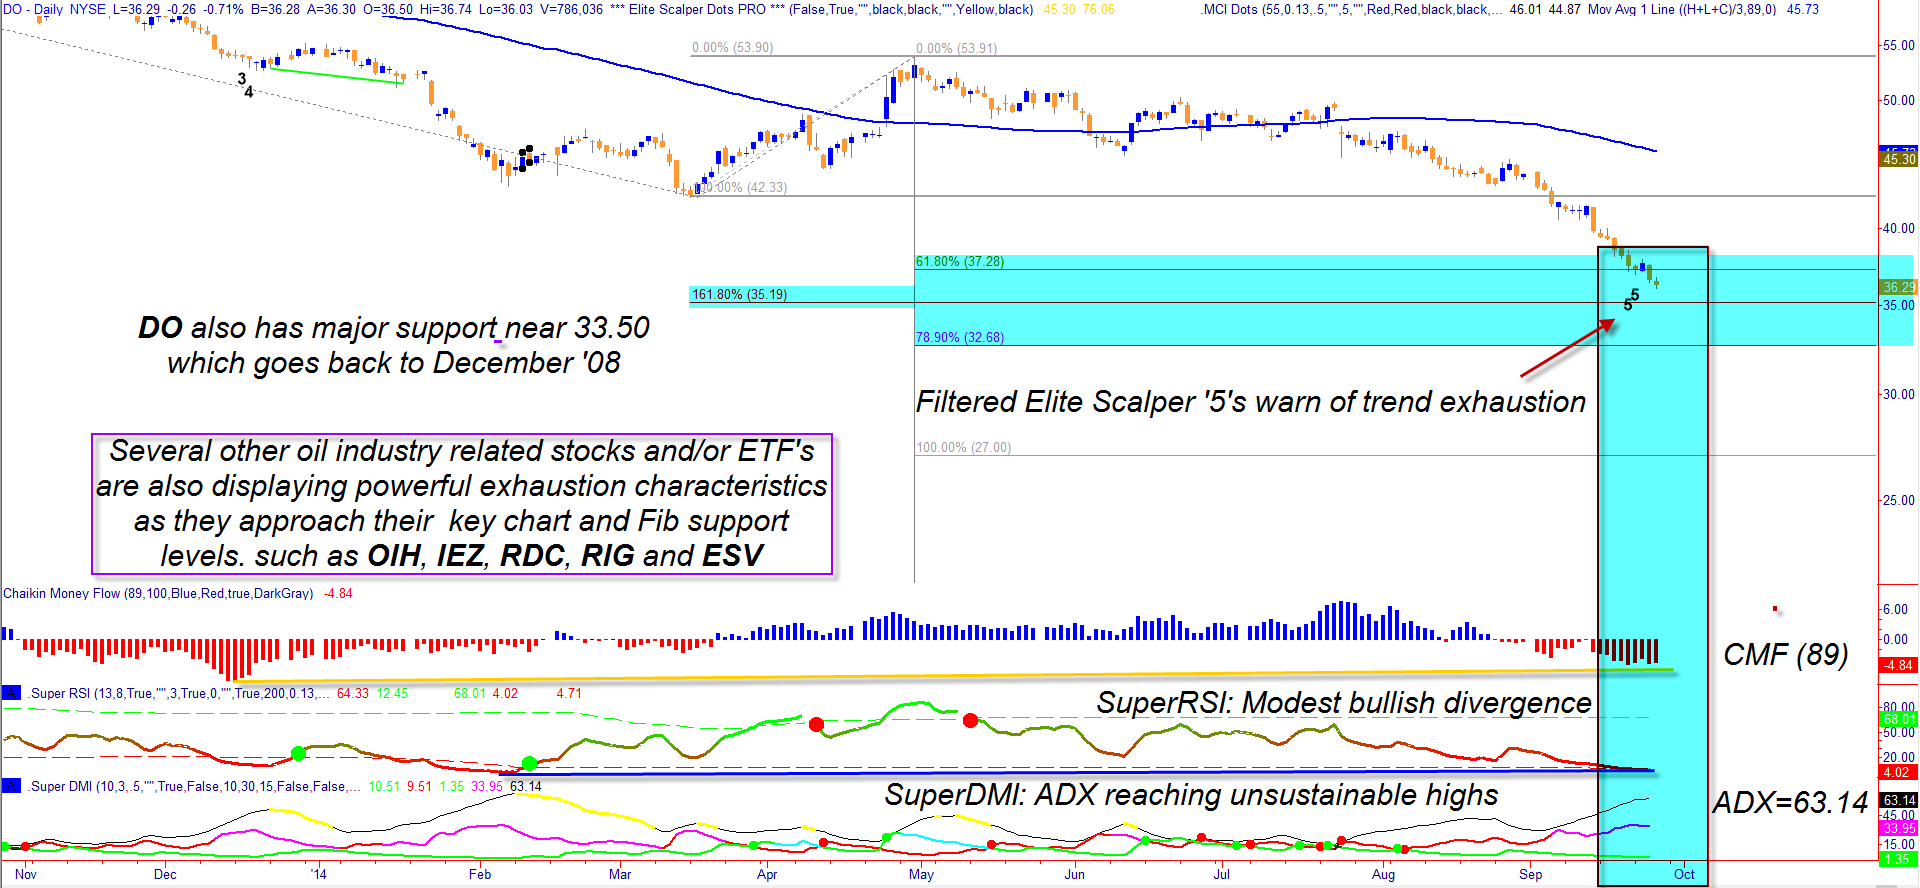
| Figure 1. Diamond Offshore Drilling (DO). With an ADX reading approaching its all-time high at a time when signs of trend exhaustion have appeared, traders and bargain-hunters will be monitoring for signs of a bullish reversal in the blue horizontal range depicted on the chart. |
| Graphic provided by: TradeStation. |
| Graphic provided by: Elite Trader Indicators by Fibozachi.com. |
| |
| DO is a widely followed oil services component stock, one that is also included in the S&P 500 index (.SPX); this equity has been in a bear market for some time now — and on three time frames (daily, weekly, monthly) — ever since hitting its all-time high of $118.44 back in December 2007. Now trading in the lower 36.00 range, the stock has managed to make many powerful swing/trending moves since the peak, but the general trend is still very bearish overall. However, at the moment DO and its peers in its industry group may be getting close to the end of a strong down swing that commenced in late April 2014. The technical clues that this is so are compelling and worth a second look: 1. Based on Fibonacci swing target calculations, the current swing should find meaningful support near 35.19 and then at 32.68. 2. DO has powerful support between 33.33 and 33.87; these are the levels at which the massive selloff from the December 2007 highs found solid support in late 2008/early 2009. 3. DO's daily chart reveals a bullish RSI divergence. 4. Long-term money flow is still negative, but is better than it was in December 2013. 5. The twin '5' markers near the recent price candles are trend exhaustion signals. 6. The Market Chop index also issued an 'exit shorts' signal two trading sessions ago. 7. The ADX (average directional index) is now at 63.14 and is one of the highest readings ever witnessed during bearish phases in this stock; typically, this is another high probability exhaustion signal. 8. Finally, the following oil services industry group tickers are flashing almost identical trend exhaustion signals: RDC, ESV, RIG and the oil services ETF (OIH) is also in agreement, too. Taken as a whole, the image presented for DO is one of a large cap stock that is coming close to a key bullish reversal point, along with most of the stocks in its industry group. |

|
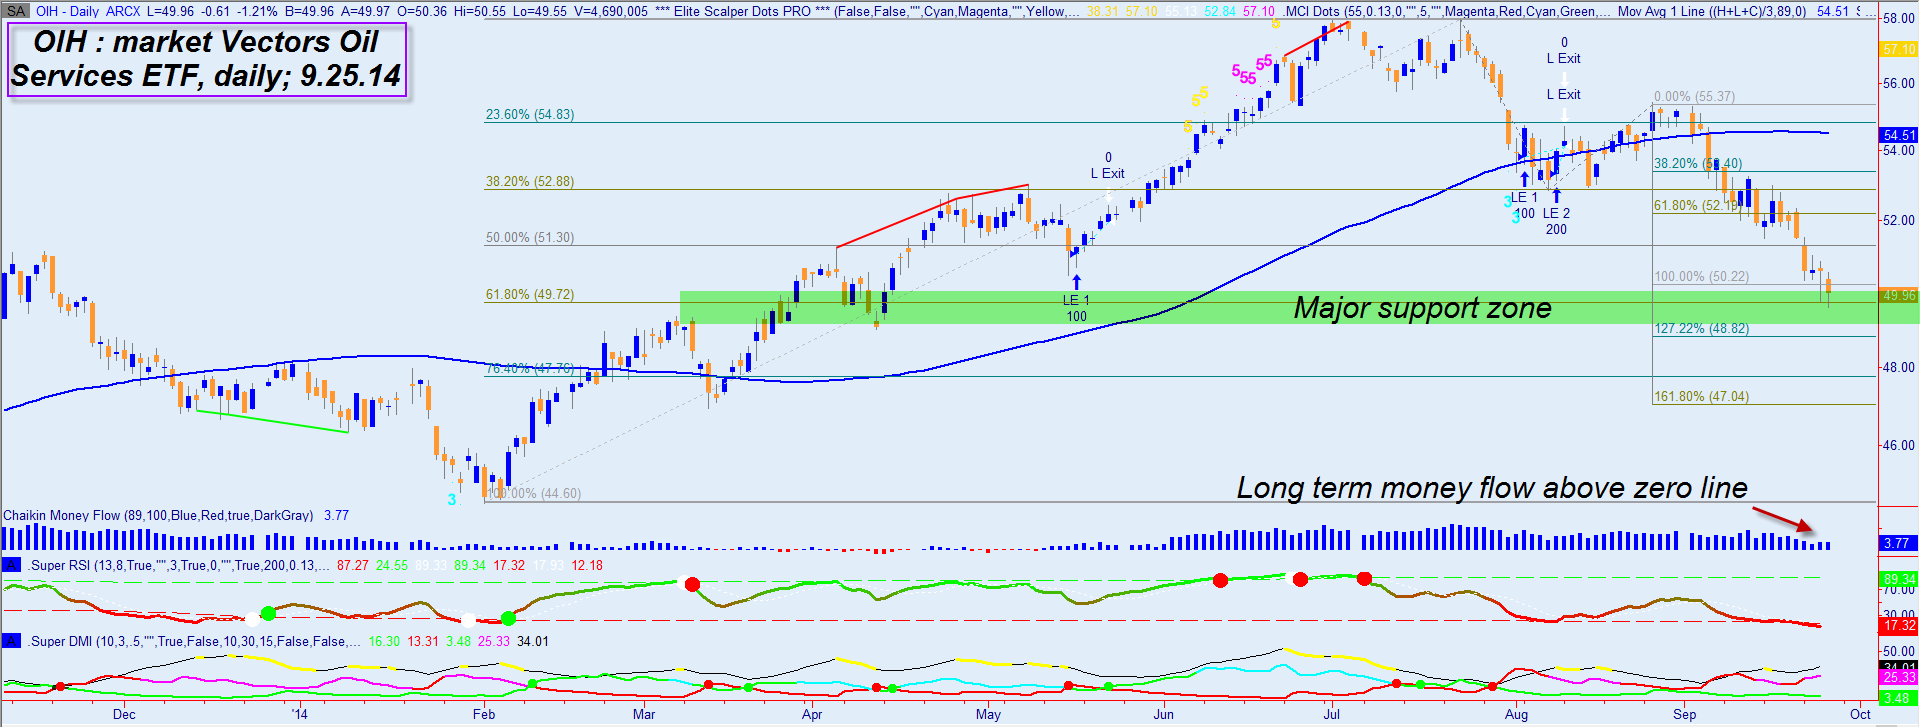
| Figure 2. The Market Vectors Oil Service ETF (OIH) has also entered a high probability bullish reversal price zone, as have several of its key components such as RIG, ESV and RDC. |
| Graphic provided by: TradeStation. |
| Graphic provided by: Elite Trader Indicators by Fibozachi.com. |
| |
| The daily chart for the Market Vectors Oil Services ETF (OIH) in Figure 2 shows a similar pattern as DO in that both are at/near powerful support/reversal zones. This could be an industry on the verge of a nice 5-10% short covering bounce in the next few weeks, so monitor the charts in the group for signs of trend exhaustion, bullish candle formations and breaks back above the highest high of the previous three sessions to alert you to strong reversal plays. Put sellers should find this impending reversal to be especially profitable. Keep your account risk modest and remember to trade wisely until we meet here again. |
Freelance financial markets writer and online publisher of the Trendzetterz.com S&P 500 Weekly Forecast service.
| Title: | Market consultant and writer |
| Company: | Trendzetterz |
| Address: | 81 Hickory Hollow Drive |
| Crossville, TN 38555 | |
| Phone # for sales: | 904-303-4814 |
| Website: | trendzetterz.com |
| E-mail address: | support@trendzetterz.com |
Traders' Resource Links | |
| Trendzetterz has not added any product or service information to TRADERS' RESOURCE. | |
Click here for more information about our publications!
PRINT THIS ARTICLE

Request Information From Our Sponsors
- StockCharts.com, Inc.
- Candle Patterns
- Candlestick Charting Explained
- Intermarket Technical Analysis
- John Murphy on Chart Analysis
- John Murphy's Chart Pattern Recognition
- John Murphy's Market Message
- MurphyExplainsMarketAnalysis-Intermarket Analysis
- MurphyExplainsMarketAnalysis-Visual Analysis
- StockCharts.com
- Technical Analysis of the Financial Markets
- The Visual Investor
- VectorVest, Inc.
- Executive Premier Workshop
- One-Day Options Course
- OptionsPro
- Retirement Income Workshop
- Sure-Fire Trading Systems (VectorVest, Inc.)
- Trading as a Business Workshop
- VectorVest 7 EOD
- VectorVest 7 RealTime/IntraDay
- VectorVest AutoTester
- VectorVest Educational Services
- VectorVest OnLine
- VectorVest Options Analyzer
- VectorVest ProGraphics v6.0
- VectorVest ProTrader 7
- VectorVest RealTime Derby Tool
- VectorVest Simulator
- VectorVest Variator
- VectorVest Watchdog
