

HOT TOPICS LIST
- MACD
- Fibonacci
- RSI
- Gann
- ADXR
- Stochastics
- Volume
- Triangles
- Futures
- Cycles
- Volatility
- ZIGZAG
- MESA
- Retracement
- Aroon
INDICATORS LIST
LIST OF TOPICS
PRINT THIS ARTICLE
by Donald W. Pendergast, Jr.
Shares of Newmont Mining (NEM) appear to be under steady accumulation by the so-called "smart money."
Position: N/A
Donald W. Pendergast, Jr.
Freelance financial markets writer and online publisher of the Trendzetterz.com S&P 500 Weekly Forecast service.
PRINT THIS ARTICLE
ACCUM./DIST. CHAIKIN
Newmont Mining: Strong Money Flows
09/24/14 03:16:40 PMby Donald W. Pendergast, Jr.
Shares of Newmont Mining (NEM) appear to be under steady accumulation by the so-called "smart money."
Position: N/A
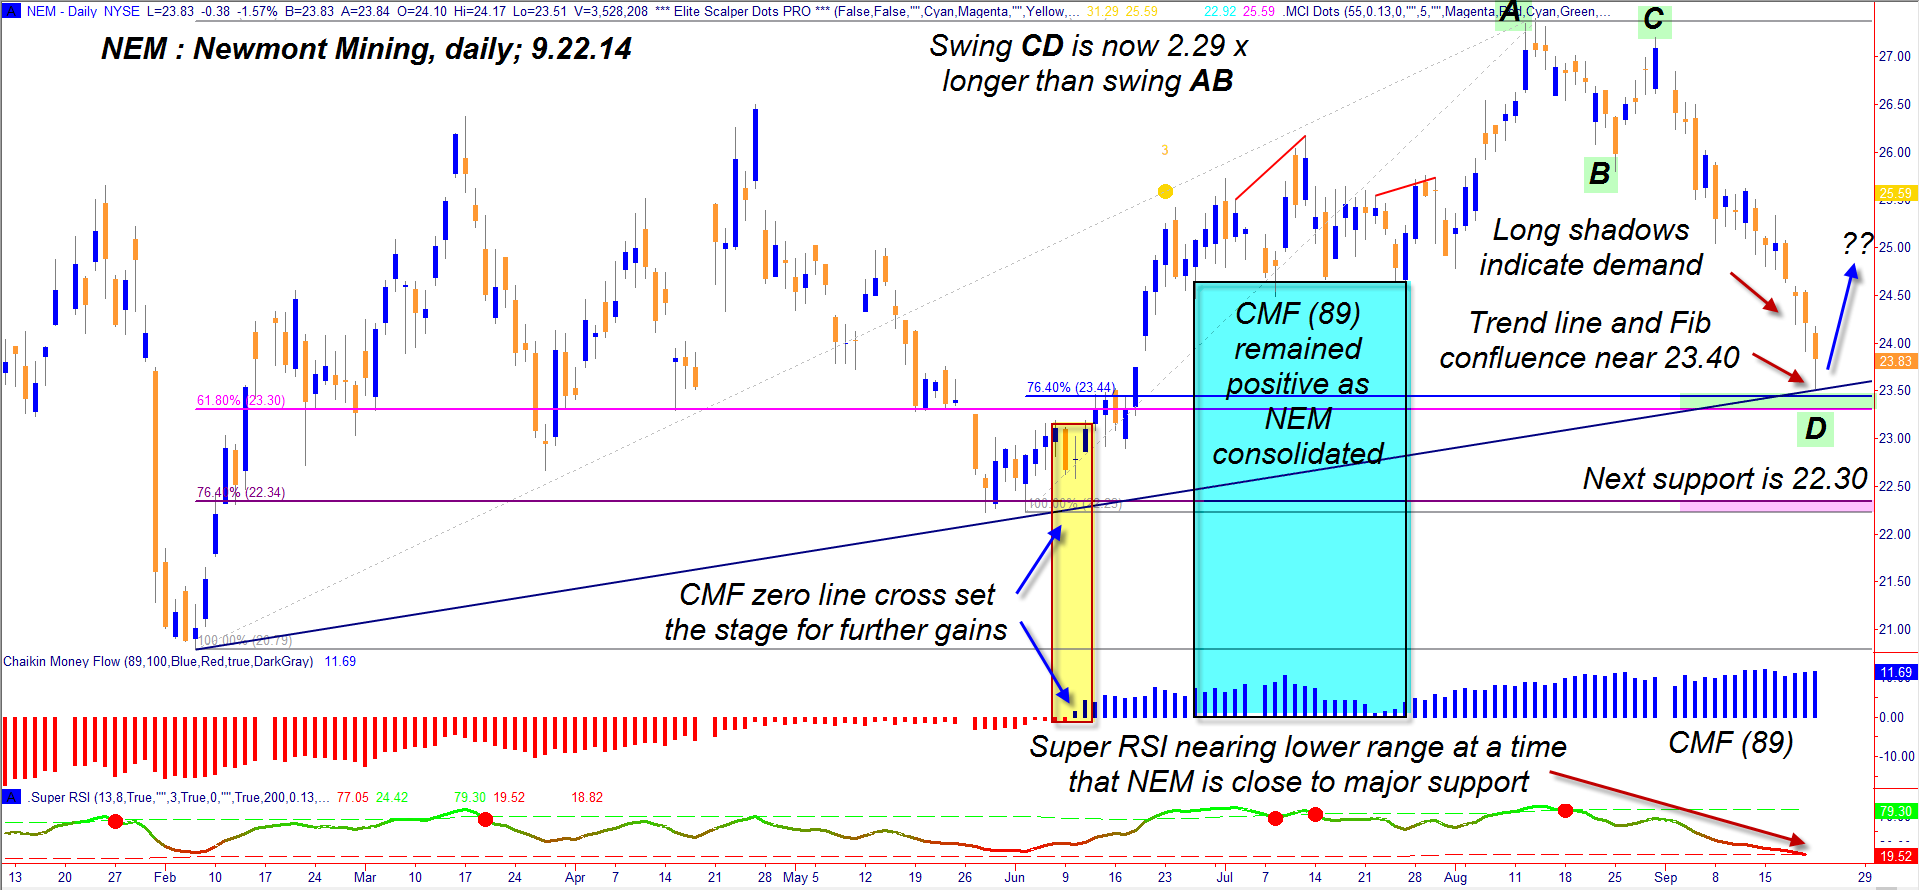
| The gold and silver market made its last major high in the autumn of 2011; shares of Newmont Mining (NEM) also peaked at that time, on November 9, 2011 at a price of $72.42 per share. Since then, the air has been steadily leaking from this overblown, overhyped market, with NEM falling as much as 71.3% at the time of its last major multicycle low on February 6, 2014. For the gold bugs, seeing this "crater" at the end of the rainbow — instead of the proverbial pot of gold — might have been enough to dissuade them from ever trading/investing in this market again, but for the big-moneyed institutional traders, the major discounting of NEM was the start of their accumulation campaign in this widely followed US-based miner's share. Here's a close look at NEM's daily chart (Figure 1) along with some ideas on how to get positioned for the stock's next trend. |
|
| Figure 1. Newmont Mining (NEM). Look for a sharp reversal at either the 23.30 or 22.30 level in the near future; the bullish long-term money flow indicates that the "smart money" intends to push NEM higher in the weeks ahead. |
| Graphic provided by: TradeStation. |
| Graphic provided by: Elite Trader Indicators by Fibozachi.com. |
| |
| Keeping a close watch on long-term money flow trends can be of great benefit to swing, trend, and position traders, regardless of the time frames they choose to participate in. The Chaikin Money Flow (CMF) histogram is perhaps the best and most predictive of all money flow measures and is best used to spot: 1. Price/money flow divergences after major rallies or declines. 2. High probability pullback entry zones within a powerful trend. 3. Zero line crossovers and trend line breaks by the CMF histogram can also serve as defacto entry/exit triggers, depending on a variety of factors. This daily chart of NEM depicts the bullish zero line cross of the money flow histogram and a period of pullback/consolidation against a positive CMF(89) histogram; while not all instances work this well, it is a reliable, consistently good predictive indicator when used in these ways. Not shown (to avoid clutter) is a wonderful bullish price/money flow divergence that manifested between December 2013 and February 2014; it also presaged the multicycle low of February 6, 2014 in the stock. History never repeats the same way, but since NEM's money flow histogram is still at an incredibly high level despite the vicious three week decline that has given the stock a 13% haircut, savvy traders now know it's time to look for the next major support level to plan their next long entry in this gold miner's stock. |
|
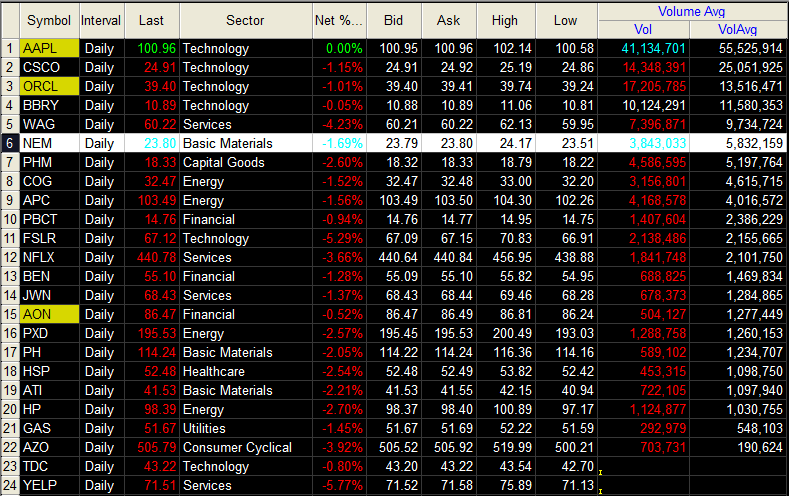
| Figure 2. NEM is approaching a key make-or-break point, as are all of the other big name stocks on this list. Technology stocks are likely to take the biggest hit as 2014 gradually comes to a close. |
| Graphic provided by: TradeStation. |
| Graphic provided by: TradeStation RadarScreen. |
| |
| A potentially strong support zone now exists at the intersection of a major uptrend line and twin Fibonacci retracement levels (61.8% and 76.4%) right around the 23.30/23.44 level, and that the current downswing from the August 29, 2014 high is now 2.29 times longer than the August 13, 2014 - August 25, 2014 downswing also suggests that a reversal may be looming large for NEM. The SuperRSI indicator is also closing in on its lower range as all of the above is happening. There is another strong support zone at the 22.30 level; should 23.30 fail to hold, this should be a strong price magnet and a super high probability bullish reversal zone — providing the long-term money flow remains positive. A great way to play NEM at either support zone is to sell near-term expiry, out-of-the-money put options once a bullish reversal manifests; if 23.30 launches a run higher, a bullish break above the high of the previous three bars would be a good and logical place to sell the puts. A similar tactic could be used on a reversal from the 22.30 support zone. Limit your account risk to 1% and remember to trade wisely until we meet here again. |
Freelance financial markets writer and online publisher of the Trendzetterz.com S&P 500 Weekly Forecast service.
| Title: | Market consultant and writer |
| Company: | Trendzetterz |
| Address: | 81 Hickory Hollow Drive |
| Crossville, TN 38555 | |
| Phone # for sales: | 904-303-4814 |
| Website: | trendzetterz.com |
| E-mail address: | support@trendzetterz.com |
Traders' Resource Links | |
| Trendzetterz has not added any product or service information to TRADERS' RESOURCE. | |
Click here for more information about our publications!
PRINT THIS ARTICLE

Request Information From Our Sponsors
- StockCharts.com, Inc.
- Candle Patterns
- Candlestick Charting Explained
- Intermarket Technical Analysis
- John Murphy on Chart Analysis
- John Murphy's Chart Pattern Recognition
- John Murphy's Market Message
- MurphyExplainsMarketAnalysis-Intermarket Analysis
- MurphyExplainsMarketAnalysis-Visual Analysis
- StockCharts.com
- Technical Analysis of the Financial Markets
- The Visual Investor
- VectorVest, Inc.
- Executive Premier Workshop
- One-Day Options Course
- OptionsPro
- Retirement Income Workshop
- Sure-Fire Trading Systems (VectorVest, Inc.)
- Trading as a Business Workshop
- VectorVest 7 EOD
- VectorVest 7 RealTime/IntraDay
- VectorVest AutoTester
- VectorVest Educational Services
- VectorVest OnLine
- VectorVest Options Analyzer
- VectorVest ProGraphics v6.0
- VectorVest ProTrader 7
- VectorVest RealTime Derby Tool
- VectorVest Simulator
- VectorVest Variator
- VectorVest Watchdog