HOT TOPICS LIST
- MACD
- Fibonacci
- RSI
- Gann
- ADXR
- Stochastics
- Volume
- Triangles
- Futures
- Cycles
- Volatility
- ZIGZAG
- MESA
- Retracement
- Aroon
INDICATORS LIST
LIST OF TOPICS
PRINT THIS ARTICLE
by Gary Grosschadl
Indices are overbought and due for a downturn. The big question - is a big downdraft coming or just a correction before more upside?
Position: N/A
Gary Grosschadl
Independent Canadian equities trader and technical analyst based in Peterborough
Ontario, Canada.
PRINT THIS ARTICLE
CHART ANALYSIS
Elliott Wave-Type Downturn -- Papa Bear Or Baby Bear?
10/28/02 01:09:47 PMby Gary Grosschadl
Indices are overbought and due for a downturn. The big question - is a big downdraft coming or just a correction before more upside?
Position: N/A
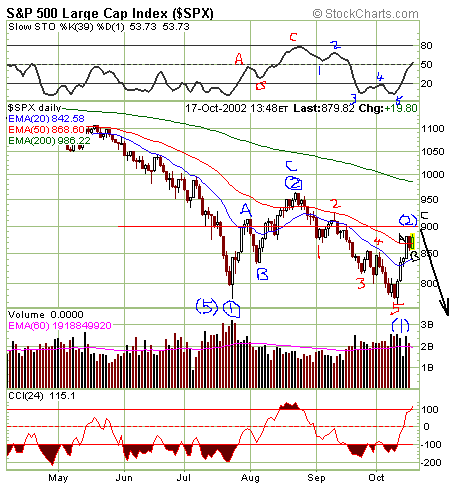
| Robert Prechter is the most high profile Elliottician and probably the most controversial as he has been sticking to his big bear scenario. This would take the Dow down thousands of points. I have done my own Elliott wave chart for personal clarification. |
| Elliott wave theory deals in probabilities and possibilities. This is why most followers have an alternate wave count as a fall back position. So it is no surprise to see a variety of different wave counts. This is just a sobering reminder that pegging down the future is not a sure thing. Prechter has taken a lot of heat for missing the biggest part of the last bull run but prior to that he called the bear markets rather well. Could it be that he is much better at analyzing the downside? |

|
| Graphic provided by: stockcharts.com. |
| |
| Steve Hochberg is Prechter's chief market analyst at his research firm. My S&P chart shows the gist of Hochberg's wave count. The downward pattern shows the previous pattern repeating, bringing the markets down to lower lows. This is a series of five waves down followed by an upward correction of three (ABC) waves up, and then another five waves down. This chart suggests that after the current run towards the 900 - 990 level (also 9000 - 9200 on the Dow), there follows an ugly five wave decline to new lows. |
| Of course there are alternate wave counts by other wave watchers. A more positive (in the shorter term) wave count has this decline only correcting down to about Dow 8000 and then climbing further up to 9000 and then turning down to set new lows. So this current decline will be carefully watched. My own thought is if the Dow 8000 doesn't hold we could very likely be hit with a downdraft to challenge previous lows. If the upside to 9000 occurs instead, there may be some fairly heavy profit taking as the markets once again becomes very overbought. It is the next retracement that becomes very important. If it holds at a higher low then the bearish wave counts are proven wrong and the markets may have a more bullish future. |
| We have to remember that Elliott wave theory makes the most sense looking back at what has occurred as the burden of proof builds to a point where there is more agreement than dissension. At one point when the final bottom is hit (if there ever is consensus) then all the Elliott wavers can "reset" their wave counts and begin their prognostications anew. At least then there may be a better consensus among them. But alas eventually human nature will take its course, views will diverge and the puzzle of the marketplace will once again be thrown askew by the splash of a wave on the beach. I like the analogy of working on a difficult puzzle on the beach between tides. Just when you think you've got it - boom it changes! |
Independent Canadian equities trader and technical analyst based in Peterborough
Ontario, Canada.
| Website: | www.whatsonsale.ca/financial.html |
| E-mail address: | gwg7@sympatico.ca |
Click here for more information about our publications!
Comments
Date: 10/29/02Rank: 5Comment:
Date: 10/29/02Rank: 3Comment:
Date: 10/31/02Rank: 4Comment:

|

Request Information From Our Sponsors
- StockCharts.com, Inc.
- Candle Patterns
- Candlestick Charting Explained
- Intermarket Technical Analysis
- John Murphy on Chart Analysis
- John Murphy's Chart Pattern Recognition
- John Murphy's Market Message
- MurphyExplainsMarketAnalysis-Intermarket Analysis
- MurphyExplainsMarketAnalysis-Visual Analysis
- StockCharts.com
- Technical Analysis of the Financial Markets
- The Visual Investor
- VectorVest, Inc.
- Executive Premier Workshop
- One-Day Options Course
- OptionsPro
- Retirement Income Workshop
- Sure-Fire Trading Systems (VectorVest, Inc.)
- Trading as a Business Workshop
- VectorVest 7 EOD
- VectorVest 7 RealTime/IntraDay
- VectorVest AutoTester
- VectorVest Educational Services
- VectorVest OnLine
- VectorVest Options Analyzer
- VectorVest ProGraphics v6.0
- VectorVest ProTrader 7
- VectorVest RealTime Derby Tool
- VectorVest Simulator
- VectorVest Variator
- VectorVest Watchdog
