HOT TOPICS LIST
- MACD
- Fibonacci
- RSI
- Gann
- ADXR
- Stochastics
- Volume
- Triangles
- Futures
- Cycles
- Volatility
- ZIGZAG
- MESA
- Retracement
- Aroon
INDICATORS LIST
LIST OF TOPICS
PRINT THIS ARTICLE
by Thomas Bopp
Goldman-Sachs is a company known for their media appearances and profit margins. If you look at the charts, you'll see that technically speaking, everything is in line for the price of GS to move over $200.
Position: Buy
Thomas Bopp
Thomas Bopp has more than 25 years experience in all kinds of trading. He mainly trades options on the short-side based on his own unique trading systems. He is also responsible for a German and Spanish free daily market newsletter, which covers the S&P 500, Ibex 35, DAX and German Bund-Future.
PRINT THIS ARTICLE
HEAD & SHOULDERS
Goldman-Sachs Over $200, Again?
09/23/14 02:51:06 PMby Thomas Bopp
Goldman-Sachs is a company known for their media appearances and profit margins. If you look at the charts, you'll see that technically speaking, everything is in line for the price of GS to move over $200.
Position: Buy
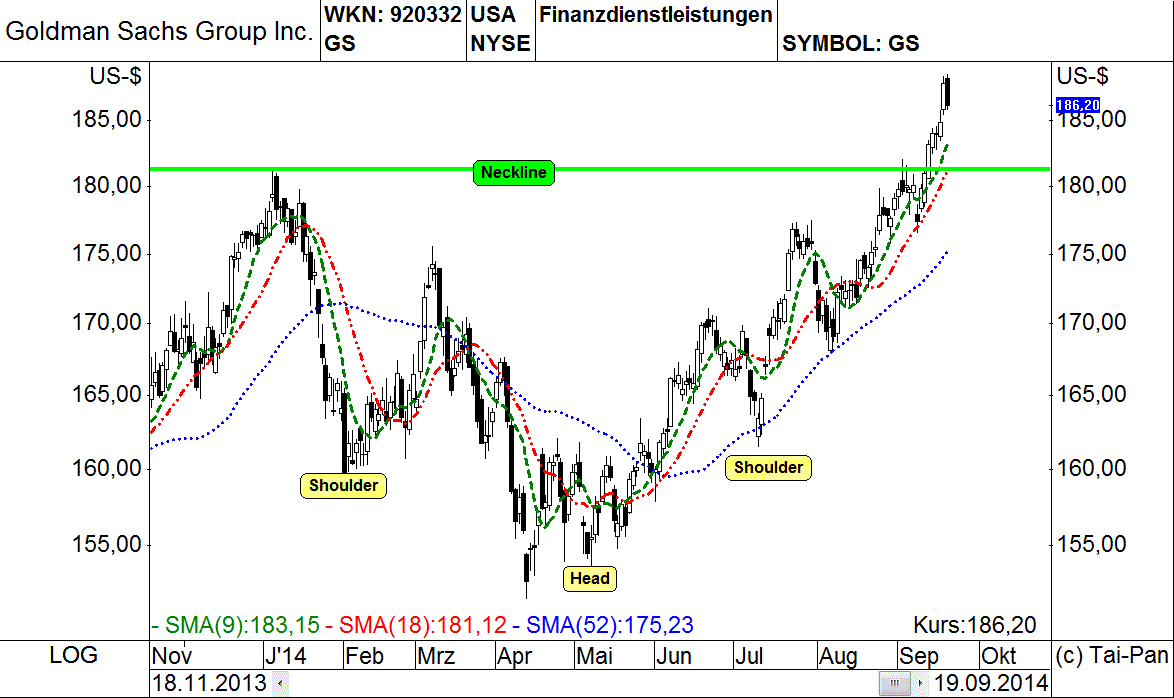
| GS stock broke out on Friday, September 12, 2014, just before the weekend. Price went above the January 2014 yearly-high while the overall market was pulling back. |

|
| Figure 1. Goldman-Sachs shows a inverted head & shoulders formation. The price of the stock has crossed above the neckline, which generated a medium-term buy signal. |
| Graphic provided by: www.lp-software.de. |
| |
| In Figure 1 you see the daily candlestick chart with a reverse head & shoulders (H&S) pattern. A buy signal confirmation is needed. The stock rose above the neckline of the reverse H&S formation. This suggests that a trend acceleration is likely. To determine the price target after price crosses above the neckline, you use the distance from the head to the neckline and add it to where price broke out above the neckline. |

|
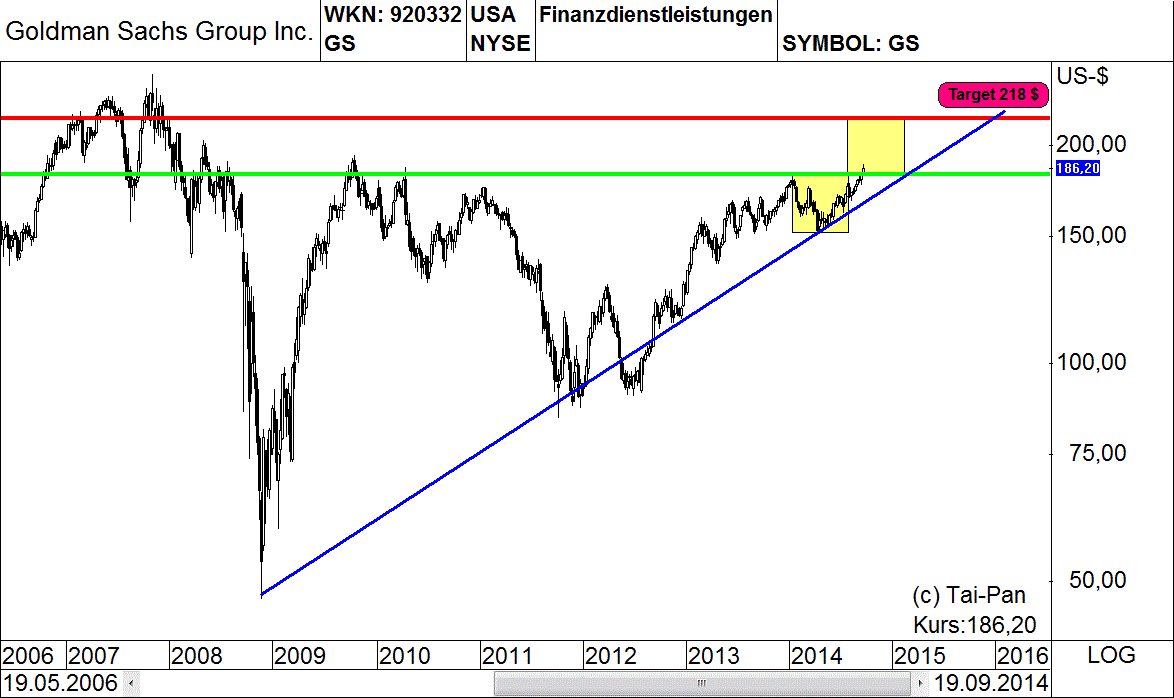
| Figure 2. Using the typical approach to calculate the price target in a reverse head & shoulders formation, the minimum price target comes to $218. This stop should be placed under the upward trend at $164. |
| Graphic provided by: www.lp-software.de. |
| |
| In Figure 2 you see the long-term chart, with a target of $218. It is interesting that the target is close to the 2007 high. The trendline of the long-term uptrend from 2009 could serve as a stop loss level for a long position. However, the position should have some space to breathe. Prices often cross trendlines for a short period of time, before resuming the longer-term trend. In the chart in Figure 2, you see two blue lines. The top line is the upward trendline while the lower line serves as a stop at $164. |

|
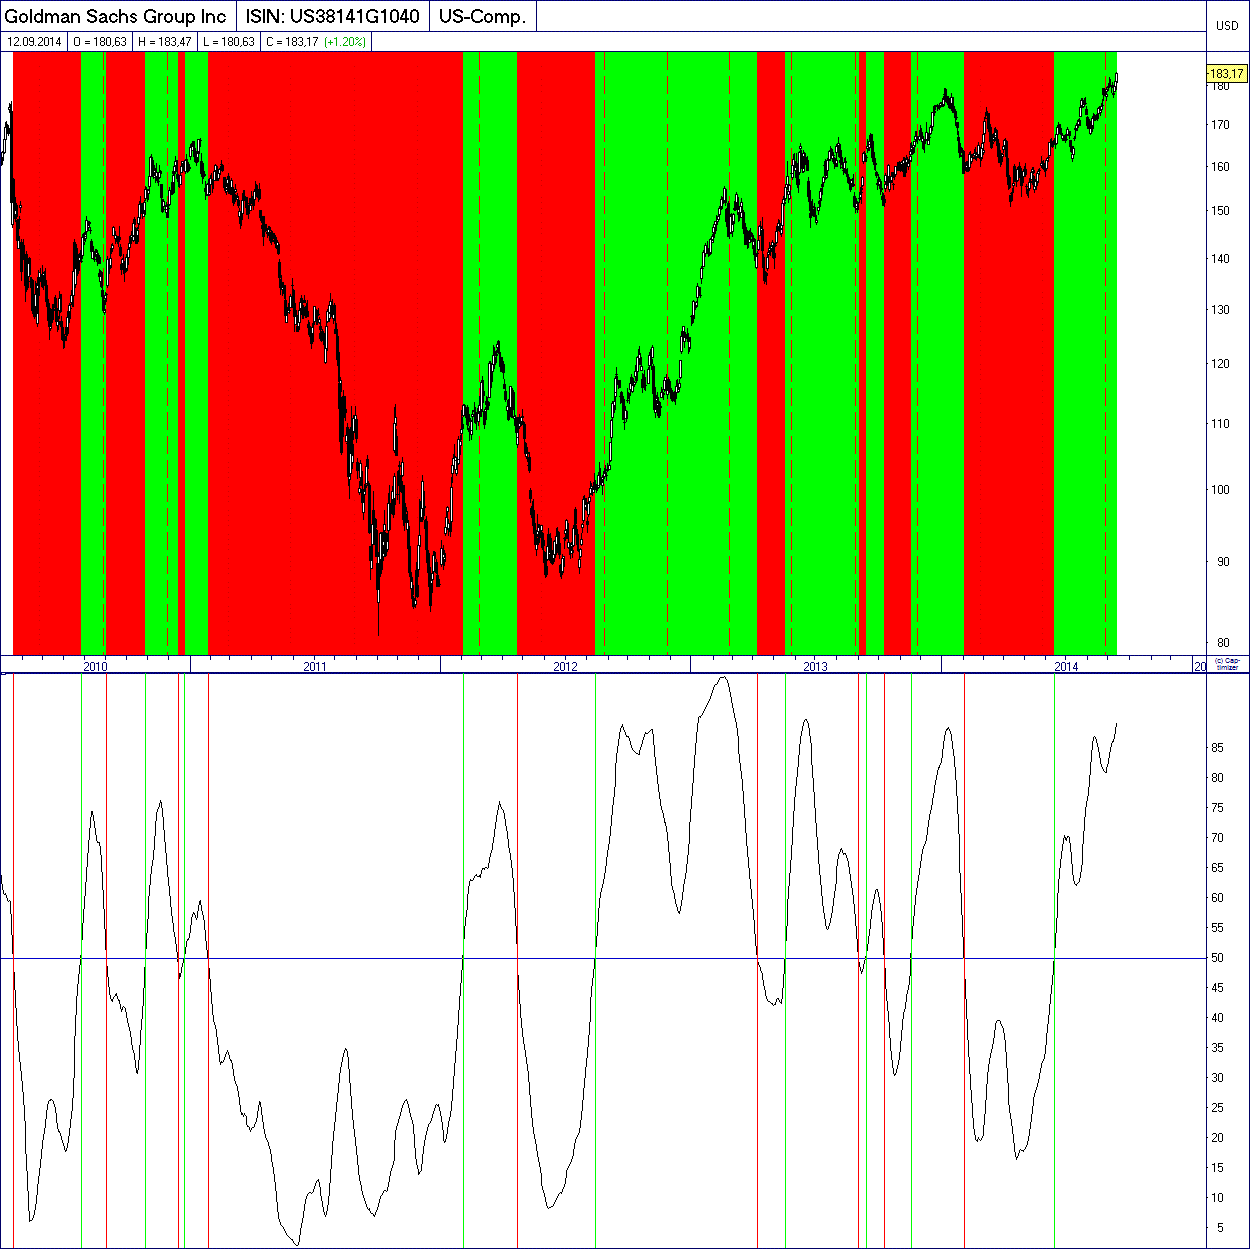
| Figure 3. Ranking is the key. The long-term picture shows buy & sell signals on the basis of a ranking indicator. The stock had already generated a long-signal two months ago. |
| Graphic provided by: www.captimizer.de. |
| |
| The risk-reward-ratio admittedly is not the best, but at 1.68 it is still ok. The stock shows relative strength against the overall market, which indicates that the stock can still continue on its uptrend for some weeks. |
| In Figure 3 you see the price chart with a ranking indicator in the subchart below it. The ranking indicator compares the stock with 4200 stocks traded on US exchanges. I calculated it on the basis of relative strength and averaged it over 20 days. When the indicator moves above 50%, it means that the stock is in the top half of those 4200 stocks and therefore a favorite among investors. The red and green marked areas in the price chart identify when the indicator crosses the 50% line; green when it crosses above and red when it crosses below. Currently, GS is in the strongest 10% of the US stock universe. For as long as it remains there, the price target is likely to be reached. |
Thomas Bopp has more than 25 years experience in all kinds of trading. He mainly trades options on the short-side based on his own unique trading systems. He is also responsible for a German and Spanish free daily market newsletter, which covers the S&P 500, Ibex 35, DAX and German Bund-Future.
| Title: | Freelance trader and analyst |
| Company: | Bopp's Financial Market Studies |
| Address: | Eichendorffweg 6 |
| 61194 Niddatal, Germany, 61194 | |
| Phone # for sales: | +49 60347961 |
| E-mail address: | webmaster@zyklusanalyst.de |
Traders' Resource Links | |
| Bopp's Financial Market Studies has not added any product or service information to TRADERS' RESOURCE. | |
Click here for more information about our publications!
Comments

Request Information From Our Sponsors
- VectorVest, Inc.
- Executive Premier Workshop
- One-Day Options Course
- OptionsPro
- Retirement Income Workshop
- Sure-Fire Trading Systems (VectorVest, Inc.)
- Trading as a Business Workshop
- VectorVest 7 EOD
- VectorVest 7 RealTime/IntraDay
- VectorVest AutoTester
- VectorVest Educational Services
- VectorVest OnLine
- VectorVest Options Analyzer
- VectorVest ProGraphics v6.0
- VectorVest ProTrader 7
- VectorVest RealTime Derby Tool
- VectorVest Simulator
- VectorVest Variator
- VectorVest Watchdog
- StockCharts.com, Inc.
- Candle Patterns
- Candlestick Charting Explained
- Intermarket Technical Analysis
- John Murphy on Chart Analysis
- John Murphy's Chart Pattern Recognition
- John Murphy's Market Message
- MurphyExplainsMarketAnalysis-Intermarket Analysis
- MurphyExplainsMarketAnalysis-Visual Analysis
- StockCharts.com
- Technical Analysis of the Financial Markets
- The Visual Investor
