HOT TOPICS LIST
- MACD
- Fibonacci
- RSI
- Gann
- ADXR
- Stochastics
- Volume
- Triangles
- Futures
- Cycles
- Volatility
- ZIGZAG
- MESA
- Retracement
- Aroon
INDICATORS LIST
LIST OF TOPICS
PRINT THIS ARTICLE
by Matt Blackman
On Friday, September 19 investors learned that Larry Ellison would be stepping down as the long-time CEO but the chart is warning us that this news may be just the tip of the bearish iceberg.
Position: N/A
Matt Blackman
Matt Blackman is a full-time technical and financial writer and trader. He produces corporate and financial newsletters, and assists clients in getting published in the mainstream media. He is the host of TradeSystemGuru.com. Matt has earned the Chartered Market Technician (CMT) designation. Find out what stocks and futures Matt is watching on Twitter at www.twitter.com/RatioTrade
PRINT THIS ARTICLE
HEAD & SHOULDERS
Oracle Chart Flashes Warning
09/29/14 04:11:51 PMby Matt Blackman
On Friday, September 19 investors learned that Larry Ellison would be stepping down as the long-time CEO but the chart is warning us that this news may be just the tip of the bearish iceberg.
Position: N/A
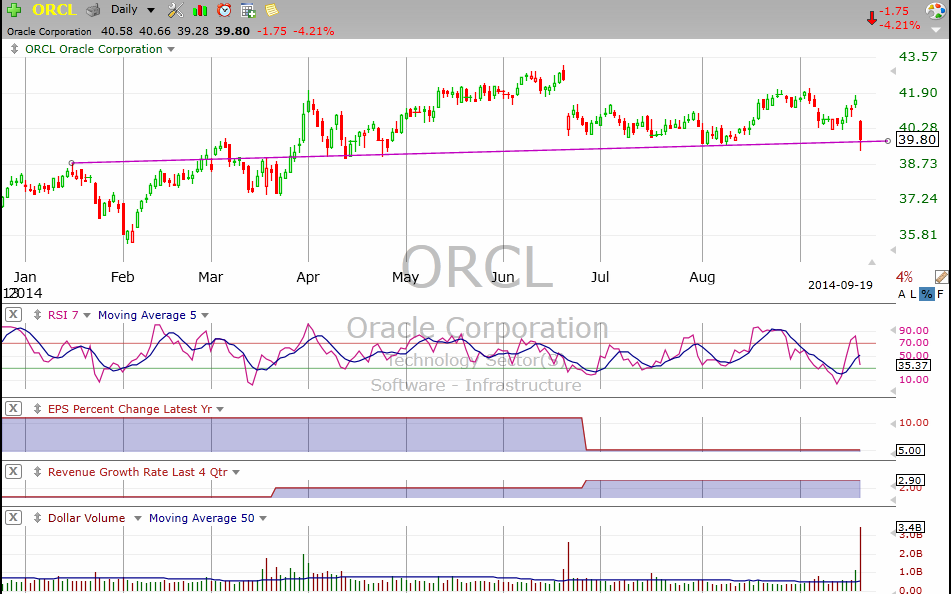
| The stock of Oracle Corp. (ORCL) dropped more than 4% after investors learned that Larry Ellison was stepping down as CEO. ORCL also reported earnings on the same day that fell short of analysts' expectations — a double whammy of bad news. However, the bearish head & shoulders (H&S) pattern that had been forming over the last eight months and that hit its neckline on Friday requires a more detailed explanation. |

|
| Figure 1. Daily chart of Oracle showing head & shoulders pattern forming with the stock closing at the neckline September 19 on much higher than average daily volume. |
| Graphic provided by: TC2000.com. |
| |
| Over the last 18 months, ORCL had seen its annual earnings per share growth shrink from 17% to 5% while annual revenue growth had increased slightly from 1.4% to 2.9% (see Figure 1). But over the last three years, this trend had been more pronounced — both EPS and revenue growth have shrunk from 40% and 42% respectively in 2011 to low single digits (see Figure 2). A confirmation of the bearish H&S pattern with the decisive breach of the neckline on above average volume and subsequent upside retest confirmed the pattern in the week following the announcement that Ellison was stepping down, but whether the pattern hits its minimum price target of $36.50 will depend on a number of factors — not the least of which will be overall market strength from here. |
| As you see from Figure 2, ORCL had a good run from late 2012 even in the face of sliding revenue and earnings growth. Clearly investors have been buying the stock hoping that this trend might be temporary and the H&S pattern could well be the final realization that its past growth glory days were behind it. As the figure also shows, the Software Infrastructure industry of which ORCL is a part of, is still on the rise which is bullish. |

|
| Figure 2. Weekly ORCL chart comparing it with the Software Infrastructure industry. |
| Graphic provided by: TC2000.com. |
| |
| No one will dispute that Larry Ellison has been successful in growing his company. Over the last 24 years, the company's stock price has appreciated more than 20% annually according to Bloomberg. |
| But the bigger question on traders' and investors' minds, especially with Ellison's announced departure as CEO, is whether this trend can continue. ORCL stock is up just 5.4% this year. SUGGESTED READING: Ellison Becomes Oracle Chairman as Catz, Hurd Split CEO Job - Bloomberg |
Matt Blackman is a full-time technical and financial writer and trader. He produces corporate and financial newsletters, and assists clients in getting published in the mainstream media. He is the host of TradeSystemGuru.com. Matt has earned the Chartered Market Technician (CMT) designation. Find out what stocks and futures Matt is watching on Twitter at www.twitter.com/RatioTrade
| Company: | TradeSystemGuru.com |
| Address: | Box 2589 |
| Garibaldi Highlands, BC Canada | |
| Phone # for sales: | 604-898-9069 |
| Fax: | 604-898-9069 |
| Website: | www.tradesystemguru.com |
| E-mail address: | indextradermb@gmail.com |
Traders' Resource Links | |
| TradeSystemGuru.com has not added any product or service information to TRADERS' RESOURCE. | |
Click here for more information about our publications!
PRINT THIS ARTICLE

|

Request Information From Our Sponsors
- VectorVest, Inc.
- Executive Premier Workshop
- One-Day Options Course
- OptionsPro
- Retirement Income Workshop
- Sure-Fire Trading Systems (VectorVest, Inc.)
- Trading as a Business Workshop
- VectorVest 7 EOD
- VectorVest 7 RealTime/IntraDay
- VectorVest AutoTester
- VectorVest Educational Services
- VectorVest OnLine
- VectorVest Options Analyzer
- VectorVest ProGraphics v6.0
- VectorVest ProTrader 7
- VectorVest RealTime Derby Tool
- VectorVest Simulator
- VectorVest Variator
- VectorVest Watchdog
- StockCharts.com, Inc.
- Candle Patterns
- Candlestick Charting Explained
- Intermarket Technical Analysis
- John Murphy on Chart Analysis
- John Murphy's Chart Pattern Recognition
- John Murphy's Market Message
- MurphyExplainsMarketAnalysis-Intermarket Analysis
- MurphyExplainsMarketAnalysis-Visual Analysis
- StockCharts.com
- Technical Analysis of the Financial Markets
- The Visual Investor
