

HOT TOPICS LIST
- MACD
- Fibonacci
- RSI
- Gann
- ADXR
- Stochastics
- Volume
- Triangles
- Futures
- Cycles
- Volatility
- ZIGZAG
- MESA
- Retracement
- Aroon
INDICATORS LIST
LIST OF TOPICS
PRINT THIS ARTICLE
by Matt Blackman
For any rally to keep going there has to be a steady price growth by strong stocks to lead the market higher. Here are two metrics that are saying that just isn't happening.
Position: N/A
Matt Blackman
Matt Blackman is a full-time technical and financial writer and trader. He produces corporate and financial newsletters, and assists clients in getting published in the mainstream media. He is the host of TradeSystemGuru.com. Matt has earned the Chartered Market Technician (CMT) designation. Find out what stocks and futures Matt is watching on Twitter at www.twitter.com/RatioTrade
PRINT THIS ARTICLE
BULL/BEAR MARKET
Market Internals Showing Signs Of Strain
09/24/14 03:09:49 PMby Matt Blackman
For any rally to keep going there has to be a steady price growth by strong stocks to lead the market higher. Here are two metrics that are saying that just isn't happening.
Position: N/A
| Every rally has had its detractors — those who constantly tell us that the good times are about to end. But when the rallies keep going, it gets harder and harder for these perma-bears to justify their positions, which ultimately leads to many of them capitulating and joining the crowd. And this has been happening in the last few weeks given that the rally has continued through September, which has traditionally been one of the toughest months of the year. |
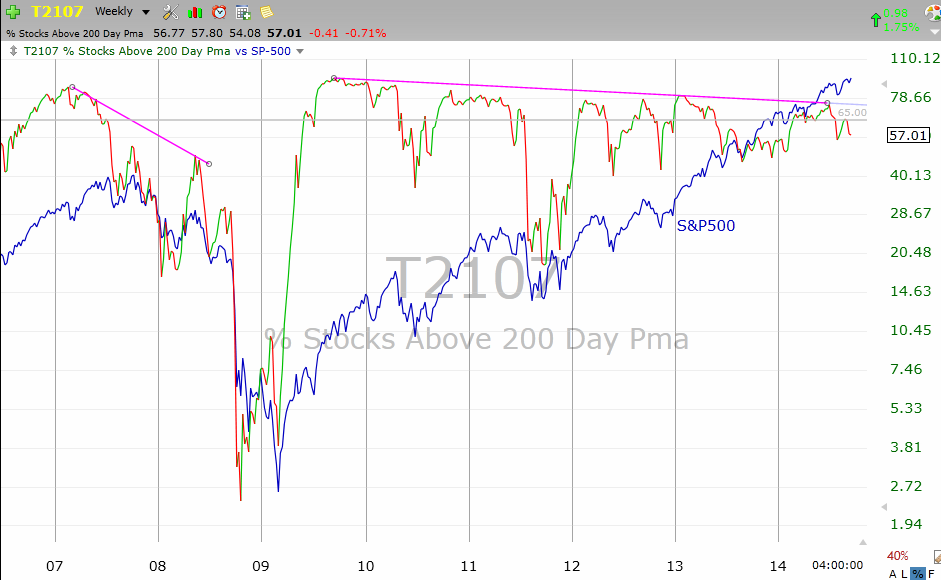
| But if rallies need stocks to keep going higher, why are we seeing two market breadth measures — namely the percentage of stocks trading above their 200-day moving average (T2107) and ratio of stocks in a bull market versus bear market steadily decline? |
|
| Figure 1. Weekly chart of the % of stocks above their 200-day moving average showing the peak in this metric back in 2010 and negative divergence since then. Meanwhile the S&P 500 has continued to power higher. |
| Graphic provided by: TC2000.com. |
| |
| I have learned that from an overall market perspective that it's prudent to keep my powder dry on new acquisitions when T2107 is below 65%. But the long-term negative divergence is more puzzling. As we saw prior to the stock peak in October 2007, T2107 began a strong downtrend beginning in March before dropping hard in early August, a good three months before the SPX peaked (Figure 1). The next scan measures the number of stocks in bull markets/bear markets with the following conditions: -Price moving up/down on a daily basis. -Within 10%/less than 80% of 52-week high. -Up/down a minimum 20% on the year. -Trade above $4 with > 100k daily volume. |
|
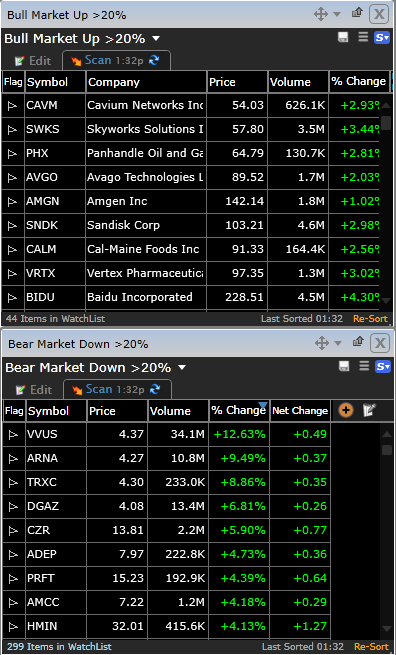
| Figure 2. Table showing the number of stocks in bull mode up 20% or more on the year (upper) versus those in bear mode down 20% of more (lower) after an up-day on the SPX on September 18, 2014. |
| Graphic provided by: TC2000.com. |
| |
| On down days, it isn't surprising to see the number of bull market stocks decline. For example on September 15, 2014 after the SPX had declined 0.63% in the last two days, the ratio of bull to bear stocks was just six to 267. Contrast this with the ratio on September 18, 2014 of 44/299 after the SPX had gained 0.6% in two days. You would expect the number of bull market stocks to be higher but not number of stocks in bear markets to increase as well. Figure 2 shows the top stocks in each category on September 18, 2014. In other words, both T2107 and bull market/bear market stocks show that the number of strong performing stocks has steadily declined while the number of stocks in persistent downtrends has remained stubbornly high. And when the rally does finally end, expect to see a more rapid deterioration in both measures. |
| From a macro market perspective, the market is certainly not cheap (see Top Spotting: Knowing What You Need to Stay Out of Trouble) as evidenced by the extreme values in a number of indicators. And although the big question as to when "the" top has been put in will only be finally answered with the help of retrospect, tightening stops and resisting the urge to load up the truck on new stock purchases may not be a bad way to help you prevent getting caught in the next major downdraft. |
Matt Blackman is a full-time technical and financial writer and trader. He produces corporate and financial newsletters, and assists clients in getting published in the mainstream media. He is the host of TradeSystemGuru.com. Matt has earned the Chartered Market Technician (CMT) designation. Find out what stocks and futures Matt is watching on Twitter at www.twitter.com/RatioTrade
| Company: | TradeSystemGuru.com |
| Address: | Box 2589 |
| Garibaldi Highlands, BC Canada | |
| Phone # for sales: | 604-898-9069 |
| Fax: | 604-898-9069 |
| Website: | www.tradesystemguru.com |
| E-mail address: | indextradermb@gmail.com |
Traders' Resource Links | |
| TradeSystemGuru.com has not added any product or service information to TRADERS' RESOURCE. | |
Click here for more information about our publications!
PRINT THIS ARTICLE

Request Information From Our Sponsors
- StockCharts.com, Inc.
- Candle Patterns
- Candlestick Charting Explained
- Intermarket Technical Analysis
- John Murphy on Chart Analysis
- John Murphy's Chart Pattern Recognition
- John Murphy's Market Message
- MurphyExplainsMarketAnalysis-Intermarket Analysis
- MurphyExplainsMarketAnalysis-Visual Analysis
- StockCharts.com
- Technical Analysis of the Financial Markets
- The Visual Investor
- VectorVest, Inc.
- Executive Premier Workshop
- One-Day Options Course
- OptionsPro
- Retirement Income Workshop
- Sure-Fire Trading Systems (VectorVest, Inc.)
- Trading as a Business Workshop
- VectorVest 7 EOD
- VectorVest 7 RealTime/IntraDay
- VectorVest AutoTester
- VectorVest Educational Services
- VectorVest OnLine
- VectorVest Options Analyzer
- VectorVest ProGraphics v6.0
- VectorVest ProTrader 7
- VectorVest RealTime Derby Tool
- VectorVest Simulator
- VectorVest Variator
- VectorVest Watchdog