

HOT TOPICS LIST
- MACD
- Fibonacci
- RSI
- Gann
- ADXR
- Stochastics
- Volume
- Triangles
- Futures
- Cycles
- Volatility
- ZIGZAG
- MESA
- Retracement
- Aroon
INDICATORS LIST
LIST OF TOPICS
PRINT THIS ARTICLE
by Matt Blackman
Last year's darling stocks became this year's pariahs. But the charts are telling us that the 3D industry is still alive and well.
Position: N/A
Matt Blackman
Matt Blackman is a full-time technical and financial writer and trader. He produces corporate and financial newsletters, and assists clients in getting published in the mainstream media. He is the host of TradeSystemGuru.com. Matt has earned the Chartered Market Technician (CMT) designation. Find out what stocks and futures Matt is watching on Twitter at www.twitter.com/RatioTrade
PRINT THIS ARTICLE
MOMENTUM
3D Industry Update
09/23/14 02:45:02 PMby Matt Blackman
Last year's darling stocks became this year's pariahs. But the charts are telling us that the 3D industry is still alive and well.
Position: N/A
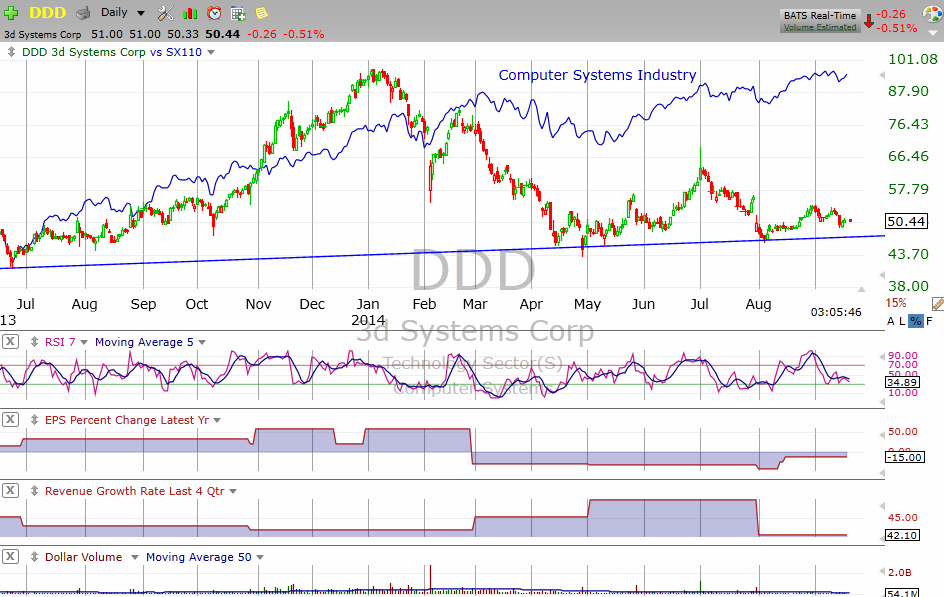
| Since bottoming in March 2009 at $1.25, 3D Systems (DDD) has racked up a return of more than 3600%. However, that return pales in comparison to where the stock was on January 3, 2014 when it peaked at $97.28 for a gain of nearly 6600% from its 2009 low. Those who exited avoided a nearly 50% drawdown and no doubt many traders and investors have written the stock and sector off as a result. But that decision may be worth reconsidering given what has happened in the interim. |
| Yes, DDD has continued to struggle although it looks to have put in a bottom around $45.50 (Figure 1). But its competitor, Stratasys Corp. (SSYS) is faring better, especially when you compare revenue and earnings growth. As of the latest data, DDD showed revenue growth of 47% and earnings per share growth of minus 15% — evidence that the company is now spending more than it earns to grow the business. |
|
| Figure 1. Here you see the daily chart of 3D Systems (DDD) which peaked in early January but struggled since then. Meanwhile, its industry — computer systems — has continued to flourish. |
| Graphic provided by: TC2000.com. |
| |
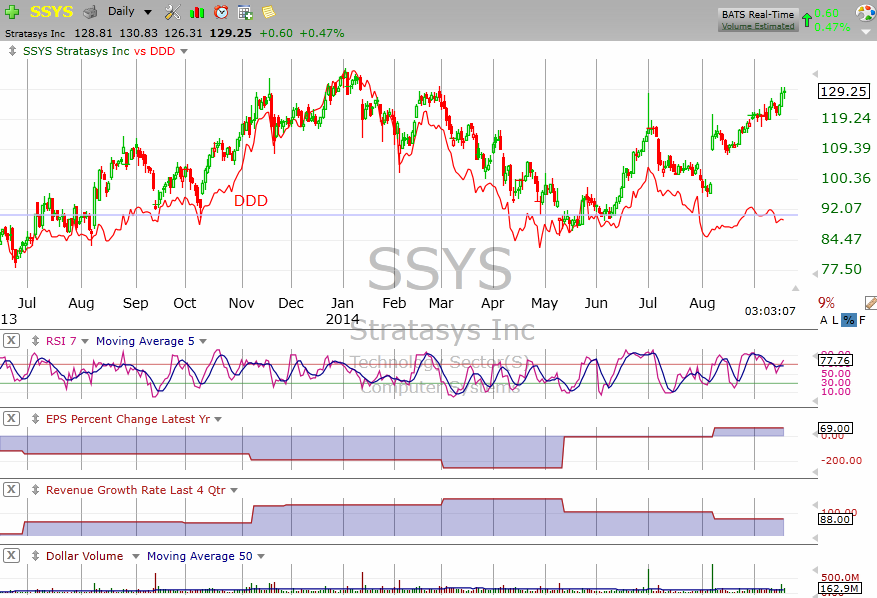
| Compare this to SSYS with revenue and earnings growth of 88 and 69% respectively (Figure 2). Unlike its rival, the company has managed to grow earnings even amid a declining rate of revenue growth. |
|
| Figure 2. Daily chart comparing 3D manufacturer Stratasys with 3D Systems showing why this stock has outperformed its competitor. |
| Graphic provided by: TC2000.com. |
| |
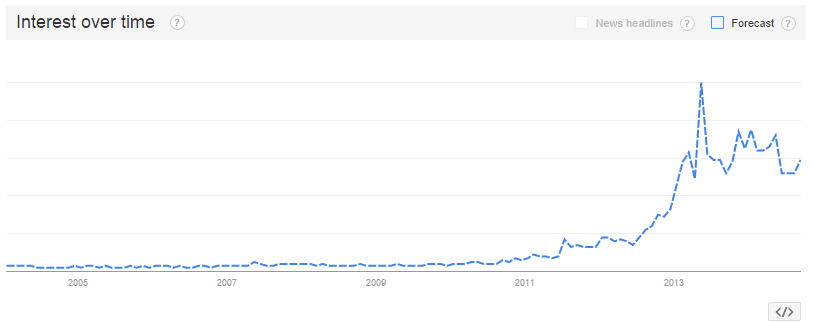
| As Figure 3 shows, interest in 3D printing may have weakened but it has certainly not dropped to zero. This chart from Google trends shows the level of search interest for the 3D printing industry with search interest peaking in May 2013 but holding well above 2012 and prior levels. The greatest interest came from Singapore, followed closely by the US, New Zealand, Australia, and Hong Kong according to the webpage. |
|
| Figure 3. Chart showing search interest in 3D printing from Google Trends showing the peak in interest in May 2013. The program also generates a forecast into 2015 by clicking the "Forecast" box. |
| Graphic provided by: http://goo.gl/f3kdhX. |
| |
| As long as the current stock rally maintains momentum, 3D printers, especially those with the best earnings potential, should continue to make those who know how to pick the winners handsome profits. |
Matt Blackman is a full-time technical and financial writer and trader. He produces corporate and financial newsletters, and assists clients in getting published in the mainstream media. He is the host of TradeSystemGuru.com. Matt has earned the Chartered Market Technician (CMT) designation. Find out what stocks and futures Matt is watching on Twitter at www.twitter.com/RatioTrade
| Company: | TradeSystemGuru.com |
| Address: | Box 2589 |
| Garibaldi Highlands, BC Canada | |
| Phone # for sales: | 604-898-9069 |
| Fax: | 604-898-9069 |
| Website: | www.tradesystemguru.com |
| E-mail address: | indextradermb@gmail.com |
Traders' Resource Links | |
| TradeSystemGuru.com has not added any product or service information to TRADERS' RESOURCE. | |
Click here for more information about our publications!
PRINT THIS ARTICLE

Request Information From Our Sponsors
- StockCharts.com, Inc.
- Candle Patterns
- Candlestick Charting Explained
- Intermarket Technical Analysis
- John Murphy on Chart Analysis
- John Murphy's Chart Pattern Recognition
- John Murphy's Market Message
- MurphyExplainsMarketAnalysis-Intermarket Analysis
- MurphyExplainsMarketAnalysis-Visual Analysis
- StockCharts.com
- Technical Analysis of the Financial Markets
- The Visual Investor
- VectorVest, Inc.
- Executive Premier Workshop
- One-Day Options Course
- OptionsPro
- Retirement Income Workshop
- Sure-Fire Trading Systems (VectorVest, Inc.)
- Trading as a Business Workshop
- VectorVest 7 EOD
- VectorVest 7 RealTime/IntraDay
- VectorVest AutoTester
- VectorVest Educational Services
- VectorVest OnLine
- VectorVest Options Analyzer
- VectorVest ProGraphics v6.0
- VectorVest ProTrader 7
- VectorVest RealTime Derby Tool
- VectorVest Simulator
- VectorVest Variator
- VectorVest Watchdog