HOT TOPICS LIST
- MACD
- Fibonacci
- RSI
- Gann
- ADXR
- Stochastics
- Volume
- Triangles
- Futures
- Cycles
- Volatility
- ZIGZAG
- MESA
- Retracement
- Aroon
INDICATORS LIST
LIST OF TOPICS
PRINT THIS ARTICLE
by Donald W. Pendergast, Jr.
A high-probability bullish breakout setup has appeared in shares of Allstate Corp.
Position: N/A
Donald W. Pendergast, Jr.
Freelance financial markets writer and online publisher of the Trendzetterz.com S&P 500 Weekly Forecast service.
PRINT THIS ARTICLE
TRITOP/TRI BOTTOM
ALL: Triple-Top Buy Signal
09/23/14 02:40:08 PMby Donald W. Pendergast, Jr.
A high-probability bullish breakout setup has appeared in shares of Allstate Corp.
Position: N/A
| Since coming out of a major multicycle low in September 2011, shares of Allstate Corp. (ALL) have run higher by 176% and are setting up for what appears to be another surge higher — this time from a triple-top breakout buy pattern. Here's a closer look now. |

|
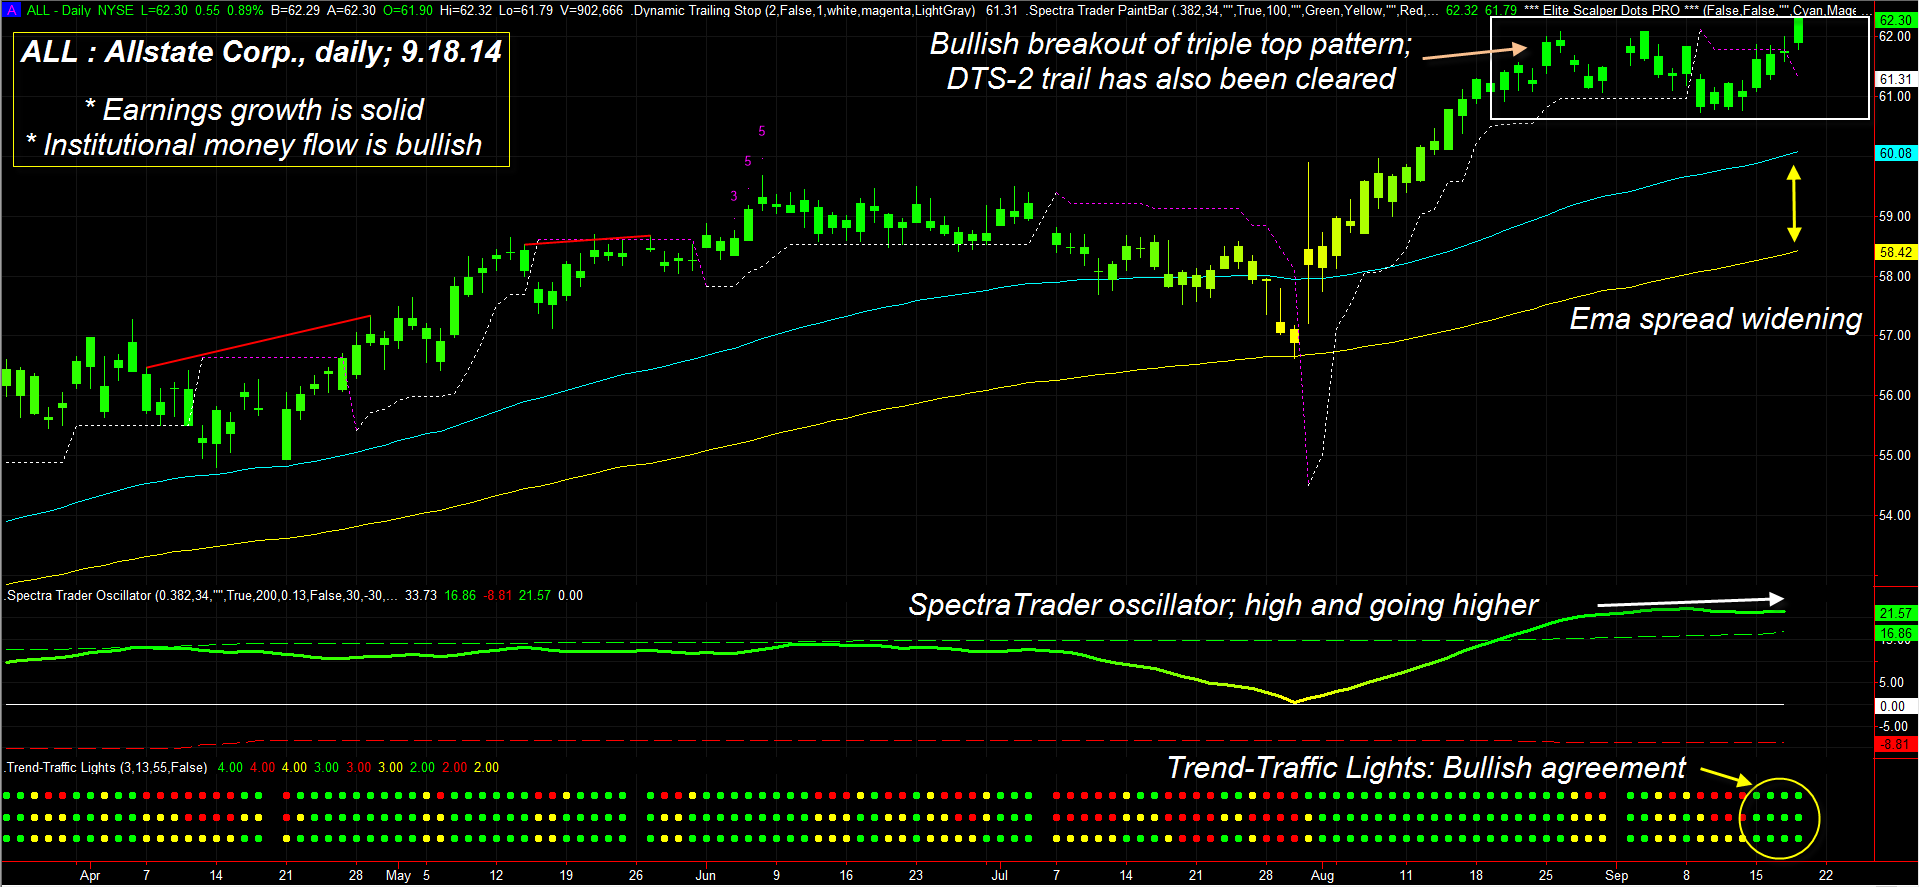
| Figure 1. Allstate Corp. (ALL): No less than eight technical and/or fundamental dynamics agree that the line of least resistance for ALL is toward higher prices. Triple top breakout buy patterns tend to attract plenty of trader/investor interest. |
| Graphic provided by: TradeStation. |
| Graphic provided by: Elite Trader Indicators by Fibozachi.com. |
| |
| Once established, secular bullish trends in a sector, industry group, or individual stock can provide an ongoing stream of long re-entry opportunities for swing and trend traders; one of the best looking, high probability setups currently offered in this amazing 5 1/2 year old bull market can be found on the daily chart of Allstate Corp. (ALL) in Figure 1, where the following dynamics are at work: 1. A beautiful, well-proportioned triple top breakout buy pattern is now complete. 2. The 89-day Chaikin Money Flow (CMF)(89) histogram is in a very bullish stance. 3. The spread between the 60- and 131-day exponential moving averages (EMA) is widening. 4. ALL has just broken above a key short trailing stop level. 5. The SpectraTrader oscillator is once again rising. 6. The Trend-Traffic light panel is now into its fourth straight day of bullish trend agreement. 7. ALL also boasts a bullish fundamental score, rapidly rising over the past week. 8. ALL is modestly outperforming the S&P 500 index (.SPX, SPY) across numerous time frames. |

|
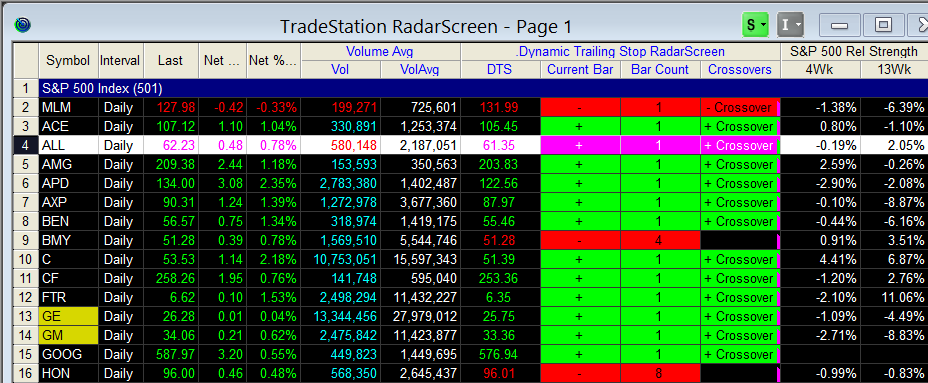
| Figure 2. ALL has flashed a bullish DTS-2 (dynamic trailing stop with input value of 2) crossover, as have numerous other large cap stocks. |
| Graphic provided by: TradeStation. |
| Graphic provided by: TradeStation RadarScreen. |
| |
| The combined sum of those eight technical/fundamental inputs paints a bullish picture for ALL going forward, with the technical setup now complete. Here's the simple and straightforward long play for swing/trend traders: 1. Buy ALL as long as it stays above 62.20, since the triple top breakout has already occurred. 2. Once in the position, simply manage it with the trailing stop shown on the chart; this one uses an input value of two and will automatically adjust at the end of the trading session; the current value of the trail is 61.27. Using a trailing stop input value of three or 3.82 may allow for more potential gains if ALL remains strong for an extended period of time. 3. Covered call traders might want to focus on the October 2014 ALL $62.50 calls; the bid/ask spread is close, daily time decay is beginning to accelerate and the daily volume and open interest figures are also acceptable. The delta is modest at .4625 and will decrease as a byproduct of the rapid time decay demonstrated by options with one month or less of remaining time value, unless ALL has a rapid surge higher soon. No matter how you choose to play the bullish action in ALL here, your main edge is its steadily, bullish price momentum, strong institutional money flows, and an attractive earnings growth forecast. Keep your account risks at 2% or less on your ALL play and remember to trade wisely until we meet here again. |
Freelance financial markets writer and online publisher of the Trendzetterz.com S&P 500 Weekly Forecast service.
| Title: | Market consultant and writer |
| Company: | Trendzetterz |
| Address: | 81 Hickory Hollow Drive |
| Crossville, TN 38555 | |
| Phone # for sales: | 904-303-4814 |
| Website: | trendzetterz.com |
| E-mail address: | support@trendzetterz.com |
Traders' Resource Links | |
| Trendzetterz has not added any product or service information to TRADERS' RESOURCE. | |
Click here for more information about our publications!
PRINT THIS ARTICLE

Request Information From Our Sponsors
- VectorVest, Inc.
- Executive Premier Workshop
- One-Day Options Course
- OptionsPro
- Retirement Income Workshop
- Sure-Fire Trading Systems (VectorVest, Inc.)
- Trading as a Business Workshop
- VectorVest 7 EOD
- VectorVest 7 RealTime/IntraDay
- VectorVest AutoTester
- VectorVest Educational Services
- VectorVest OnLine
- VectorVest Options Analyzer
- VectorVest ProGraphics v6.0
- VectorVest ProTrader 7
- VectorVest RealTime Derby Tool
- VectorVest Simulator
- VectorVest Variator
- VectorVest Watchdog
- StockCharts.com, Inc.
- Candle Patterns
- Candlestick Charting Explained
- Intermarket Technical Analysis
- John Murphy on Chart Analysis
- John Murphy's Chart Pattern Recognition
- John Murphy's Market Message
- MurphyExplainsMarketAnalysis-Intermarket Analysis
- MurphyExplainsMarketAnalysis-Visual Analysis
- StockCharts.com
- Technical Analysis of the Financial Markets
- The Visual Investor
