

HOT TOPICS LIST
- MACD
- Fibonacci
- RSI
- Gann
- ADXR
- Stochastics
- Volume
- Triangles
- Futures
- Cycles
- Volatility
- ZIGZAG
- MESA
- Retracement
- Aroon
INDICATORS LIST
LIST OF TOPICS
PRINT THIS ARTICLE
by Donald W. Pendergast, Jr.
Shares of JetBlue Airways suffered their largest one-day percentage decline in three years.
Position: N/A
Donald W. Pendergast, Jr.
Freelance financial markets writer and online publisher of the Trendzetterz.com S&P 500 Weekly Forecast service.
PRINT THIS ARTICLE
BREAKOUTS
JBLU: Hard Landing Near $10.40?
09/17/14 03:30:39 PMby Donald W. Pendergast, Jr.
Shares of JetBlue Airways suffered their largest one-day percentage decline in three years.
Position: N/A
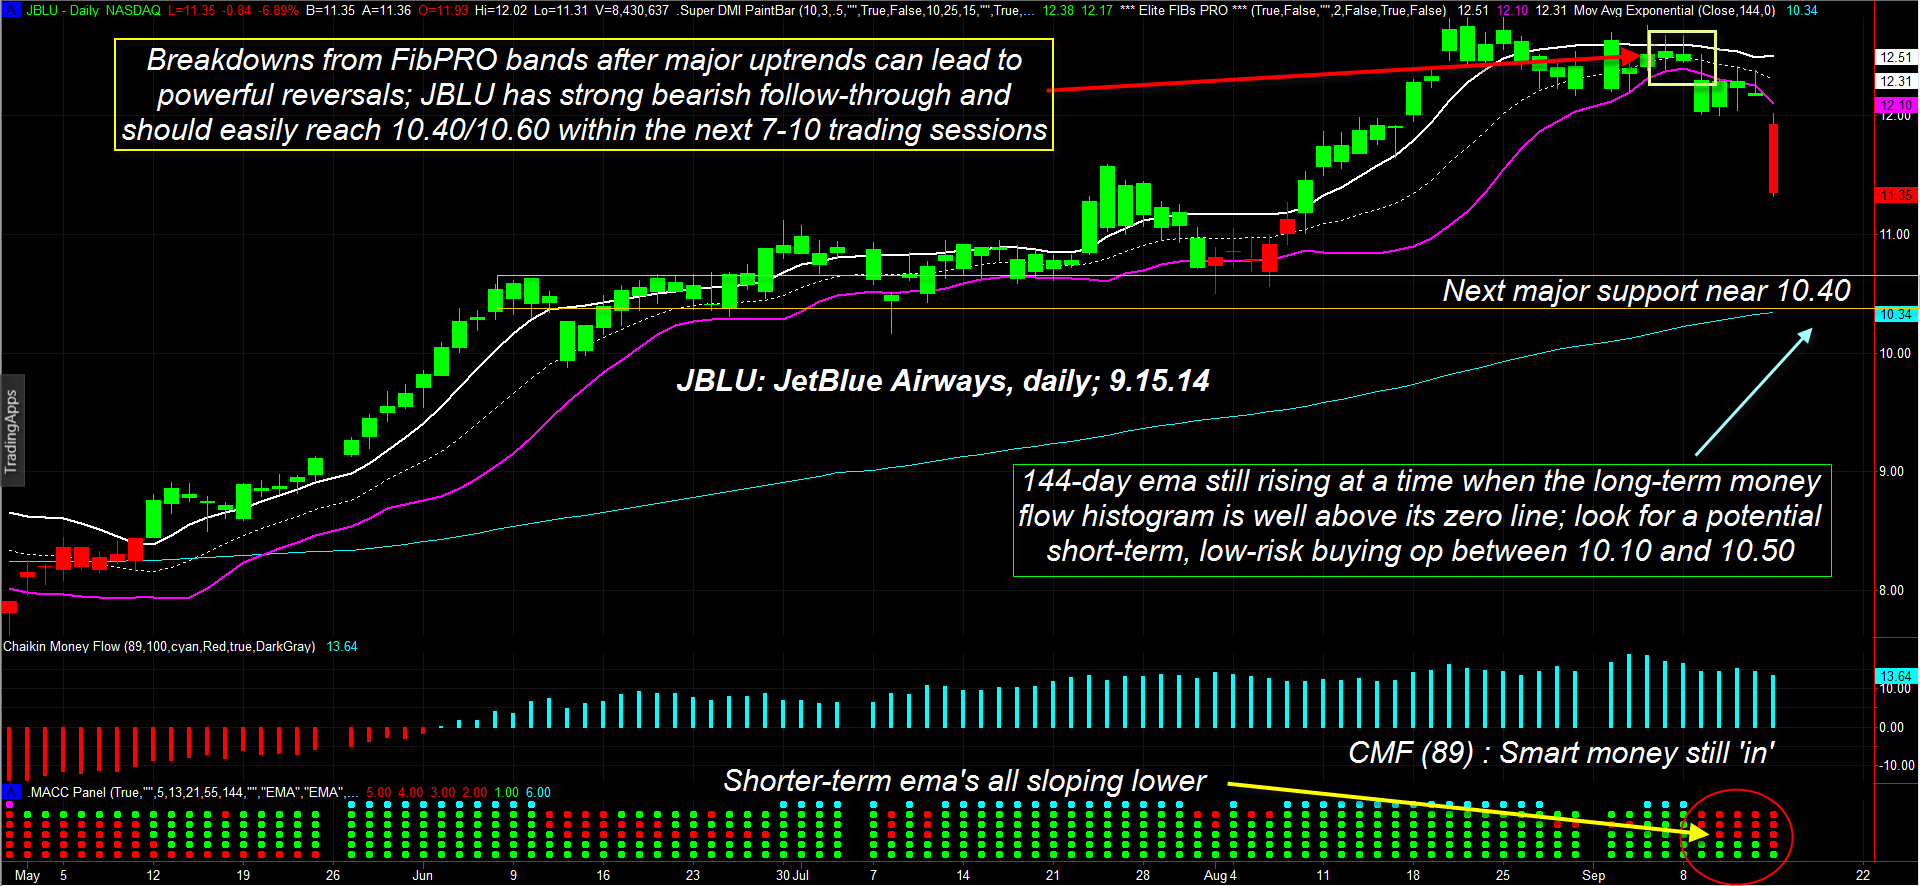
| Having risen by as much as 169% between September 2012 and August 2014, there can be little doubt as to the power of JetBlue's (JBLU) bullish ascent; now, however, that major bull run has stalled — reversing lower with the largest single-day percentage decline in many years (Figure 1). Here's a look at where the bulls may be able to find a major support area after this decline in JBLU finally plays out. |
|
| Figure 1. JetBlue Airways (JBLU) gets radically re-priced on September 15, 2014; the stock should find solid support for a strong bounce somewhere near 10.10 to 10.50. |
| Graphic provided by: TradeStation. |
| Graphic provided by: Elite Trader Indicators by Fibozachi.com. |
| |
| Moving averages, which are one of the most useful of all technical tools when used with wisdom, offer many benefits to skilled chartists and traders: 1. They quickly reveal the primary trend of a given market, with periodicities of 80 to 200 being especially useful. 2. They confirm increasing bullish/bearish momentum phases in a stock, forex, or futures market; the widening spread between a 21/55 exponential moving average (EMA) pair or a 55/144 EMA pair can help identify low-risk 'add-on' momentum opportunities. 3. Conversely, narrowing EMA spreads help confirm developing consolidation and/or trend reversal shifts. Note how JBLU remained above its cyan 144-day exponential moving average (EMA) for about 85% of its current 23-month uptrend, offering quick visual confirmation of the primary trend. Bullish breakouts above the upper FibPRO band during periods when JBLU was trading above its 144-day EMA generally resulted in profitable trade outcomes and that the best swing moves within the larger bullish trend occurred when all five of the MACC panel EMAs (5-, 13-, 21-, 55- and 144-day) were in agreement as to direction and slope. The cyan dot on top of the green EMA column is the visual confirmation for this agreement; in bearish trends, agreement is confirmed when a magenta dot appears on top of a column of red EMA dots. When you see the slopes of the EMAs change direction quickly, especially after a multimonth trend, you may be witnessing the start of a major correction or even a major trend reversal. That's certainly the case now for JBLU; all of the smaller averages are now sloping downward, with JBLU trading beneath each EMA's value. However, the long-term 144-day EMA is sill sloping higher, with price still well above it. In addition, the 89-day Chaikin Money Flow (CMF)(89) histogram is still standing tall, way above its zero line, which confirms that the "smart money" has not yet decided to dump the majority of their shares; in fact, if JBLU bottoms as projected between 10.10 and 10.50 by the first week of October 2014, look for the big institutions to start loading up again, especially if the money flow histogram remains in bullish mode. The ensuing bounce should be more than strong enough to garner $1 to $2 per share in gains for savvy stock and option swing traders. |
|
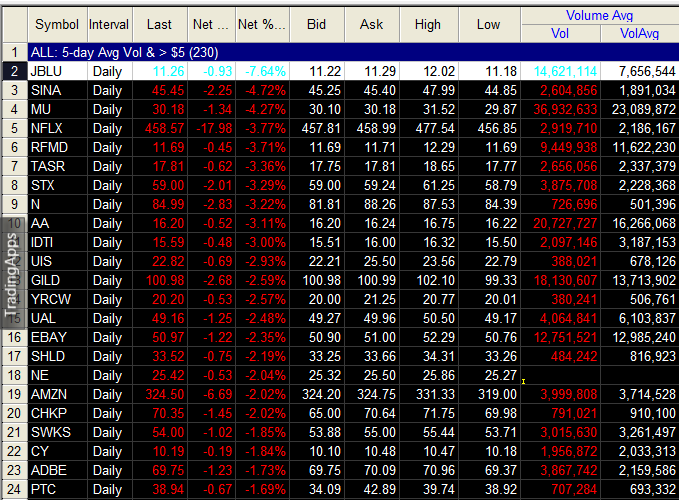
| Figure 2. JBLU was the biggest decliner on September 15, 2014 among all high-volume US stocks. |
| Graphic provided by: TradeStation. |
| Graphic provided by: TradeStation RadarScreen. |
| |
| For the moment, however, current momentum strongly favors the bears until the major support box is hit; swing traders might want to use 60-minute charts to better time new JBLU short entries down to the mid-$10 range, realizing the inherent risks of staying short near a major support area. Buying in-the-money (ITM) put options with a delta of at least .70 can also be part of such a short swing trading strategy; make sure you have at least four to six weeks of time value left for the puts so you don't get killed by time decay and implied volatility changes while you're waiting for these high probability, intraday short trades to appear. Be sure and keep your account risk at around 1%, which ever way you decide to take advantage of JBLU here and remember to trade wisely until we meet here again. The long overdue correction in the broad US markets is now underway, so make sure you pick your spots in the market wisely over the next two to four months. |
Freelance financial markets writer and online publisher of the Trendzetterz.com S&P 500 Weekly Forecast service.
| Title: | Market consultant and writer |
| Company: | Trendzetterz |
| Address: | 81 Hickory Hollow Drive |
| Crossville, TN 38555 | |
| Phone # for sales: | 904-303-4814 |
| Website: | trendzetterz.com |
| E-mail address: | support@trendzetterz.com |
Traders' Resource Links | |
| Trendzetterz has not added any product or service information to TRADERS' RESOURCE. | |
Click here for more information about our publications!
Comments
Date:�09/24/14Rank:�5Comment:�

Request Information From Our Sponsors
- VectorVest, Inc.
- Executive Premier Workshop
- One-Day Options Course
- OptionsPro
- Retirement Income Workshop
- Sure-Fire Trading Systems (VectorVest, Inc.)
- Trading as a Business Workshop
- VectorVest 7 EOD
- VectorVest 7 RealTime/IntraDay
- VectorVest AutoTester
- VectorVest Educational Services
- VectorVest OnLine
- VectorVest Options Analyzer
- VectorVest ProGraphics v6.0
- VectorVest ProTrader 7
- VectorVest RealTime Derby Tool
- VectorVest Simulator
- VectorVest Variator
- VectorVest Watchdog
- StockCharts.com, Inc.
- Candle Patterns
- Candlestick Charting Explained
- Intermarket Technical Analysis
- John Murphy on Chart Analysis
- John Murphy's Chart Pattern Recognition
- John Murphy's Market Message
- MurphyExplainsMarketAnalysis-Intermarket Analysis
- MurphyExplainsMarketAnalysis-Visual Analysis
- StockCharts.com
- Technical Analysis of the Financial Markets
- The Visual Investor