

HOT TOPICS LIST
- MACD
- Fibonacci
- RSI
- Gann
- ADXR
- Stochastics
- Volume
- Triangles
- Futures
- Cycles
- Volatility
- ZIGZAG
- MESA
- Retracement
- Aroon
INDICATORS LIST
LIST OF TOPICS
PRINT THIS ARTICLE
by Thomas Bopp
Solar power is becoming more and more important as a form of energy. Hence, it is worth your while to keep such companies on your watchlist. In terms of technical analysis, First Solar (FSLR) sits on top of the list.
Position: Accumulate
Thomas Bopp
Thomas Bopp has more than 25 years experience in all kinds of trading. He mainly trades options on the short-side based on his own unique trading systems. He is also responsible for a German and Spanish free daily market newsletter, which covers the S&P 500, Ibex 35, DAX and German Bund-Future.
PRINT THIS ARTICLE
OPTIONS TRADING
First Solar Has A Bright Future For Put Writers
09/30/14 05:30:25 PMby Thomas Bopp
Solar power is becoming more and more important as a form of energy. Hence, it is worth your while to keep such companies on your watchlist. In terms of technical analysis, First Solar (FSLR) sits on top of the list.
Position: Accumulate
| The stock of FSLR rose after consolidating over the upper resistance line for several months. In such a scenario, traders could buy FSLR or sell an out-of-the-money (OTM) put. |
|
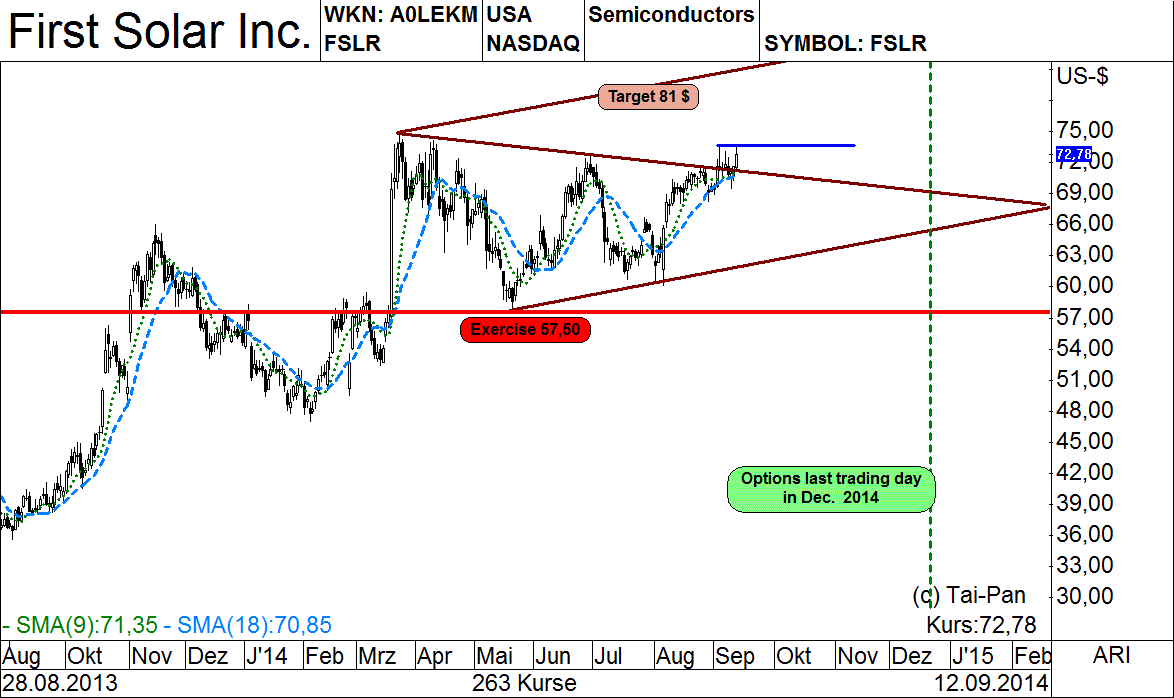
| Figure 1. First Solar broke out above its resistance level. The price target is at $81. However the stock could move sideways as can be seen by the blue horizontal resistance line. |
| Graphic provided by: www.lp-software.de. |
| |
| Figure 1 shows the daily candlestick chart of FSLR with a closing price above its resistance level, suggesting a possible buy signal. However, a further increase in price is only possible if price moves above the blue resistance line. The current price target is $81. When you buy a stock, you want to see rising prices to make a profit. If the stock moves sideways, you may want to consider selling a put with an exercise price below the last lows. You get a premium between $1.20 and $1.40 multiplied by 100. The OTM options expire on the third Friday in December 2014. If the stock closes above $57.40 on that day, you keep the full premium. Otherwise you'll get assigned and you will be long 100 stocks at $57.50 for each sold option. This strategy generates profits even if a stock has fallen slightly in price. You gain a profit margin of 15% on the required margin of $800 for each put. On the chart in Figure 1, the exercise price is seen as a red solid line. The expiration day is the dotted green vertical line. |
|
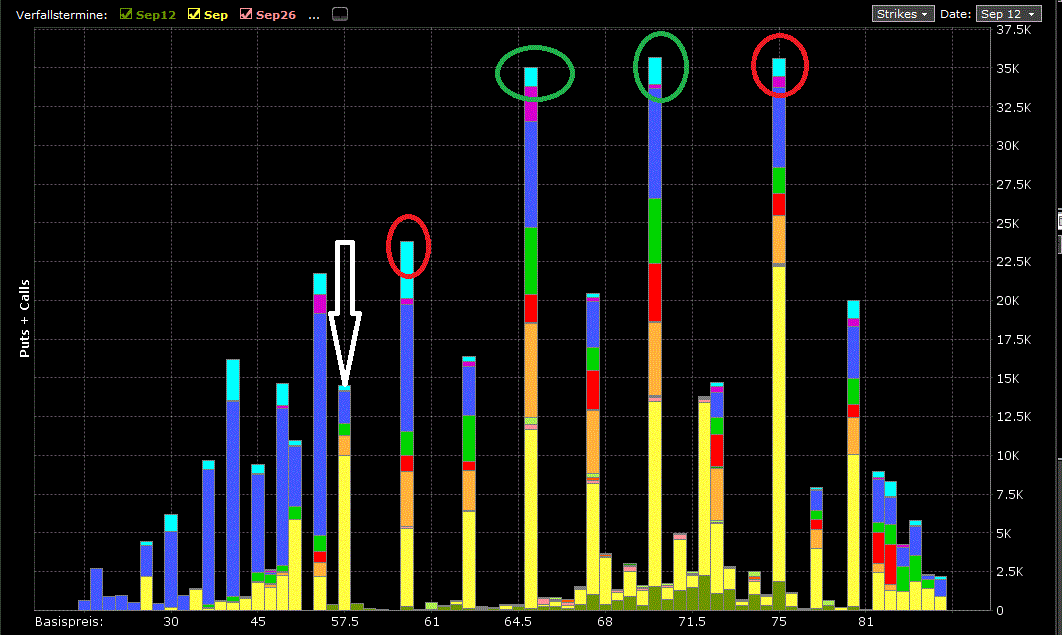
| Figure 2. The option data indicates support of $65 and $60 while the exercise price at $75 serves as resistance. The arrow shows the exercise basis of the sold put option. |
| Graphic provided by: Interactive-Broker. |
| |
| I selected the exercise price on the basis of the open-interest of all available options on this particular stock. Figure 2 shows the open-interest bars for puts and calls. The high bars at exercise areas below $65 and $70. There is resistance at $75 on the upper side. The arrow points to the exercise price of the sold option. This position is at least protected, assuming that $70, 65 and 60 hold and are defended by high-volume traders. |
|
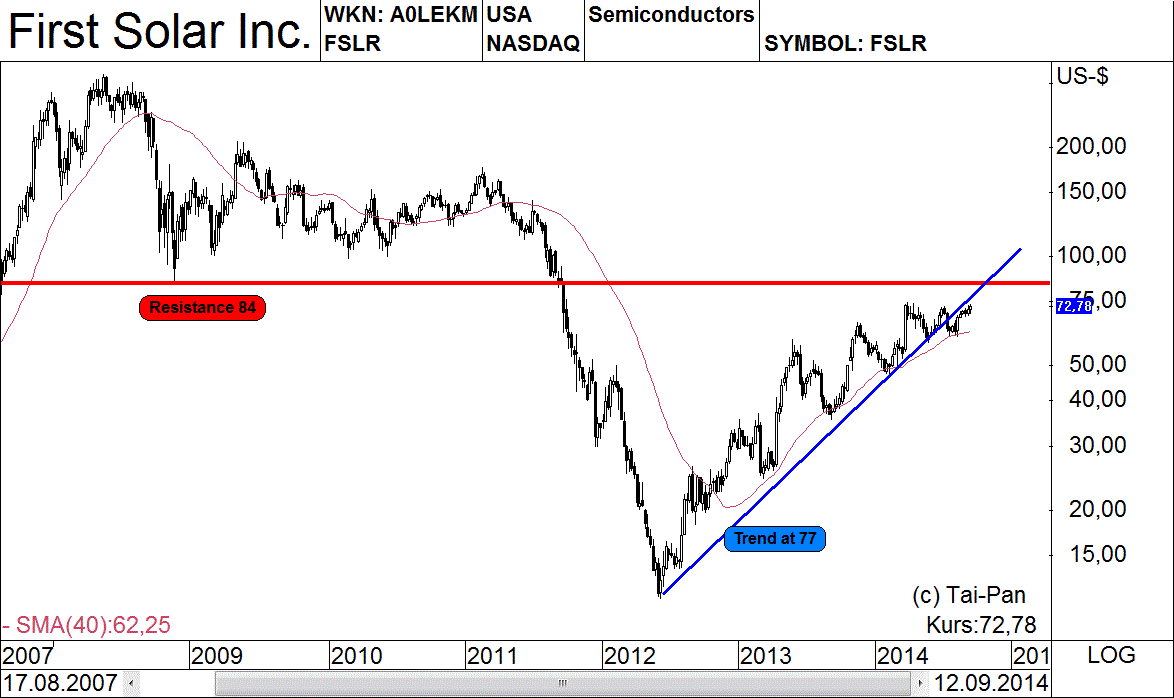
| Figure 3. The longer term chart shows a trend taking place with an initial target at $77. You would buy the put option back with a loss if the stock goes back under the 200-period simple moving average. |
| Graphic provided by: www.lp-software.de. |
| |
| The longer term chart in Figure 3 shows why a trader is better off with this OTM short put. Price is now climbing back up again, but there is still long-term resistance at $84, which can bring out the sellers. I plan to buy back the option with a loss if the stock closes below the simple 200-day moving average (SMA) for two consecutive days. Otherwise I'll let the option expire worthless. |
|
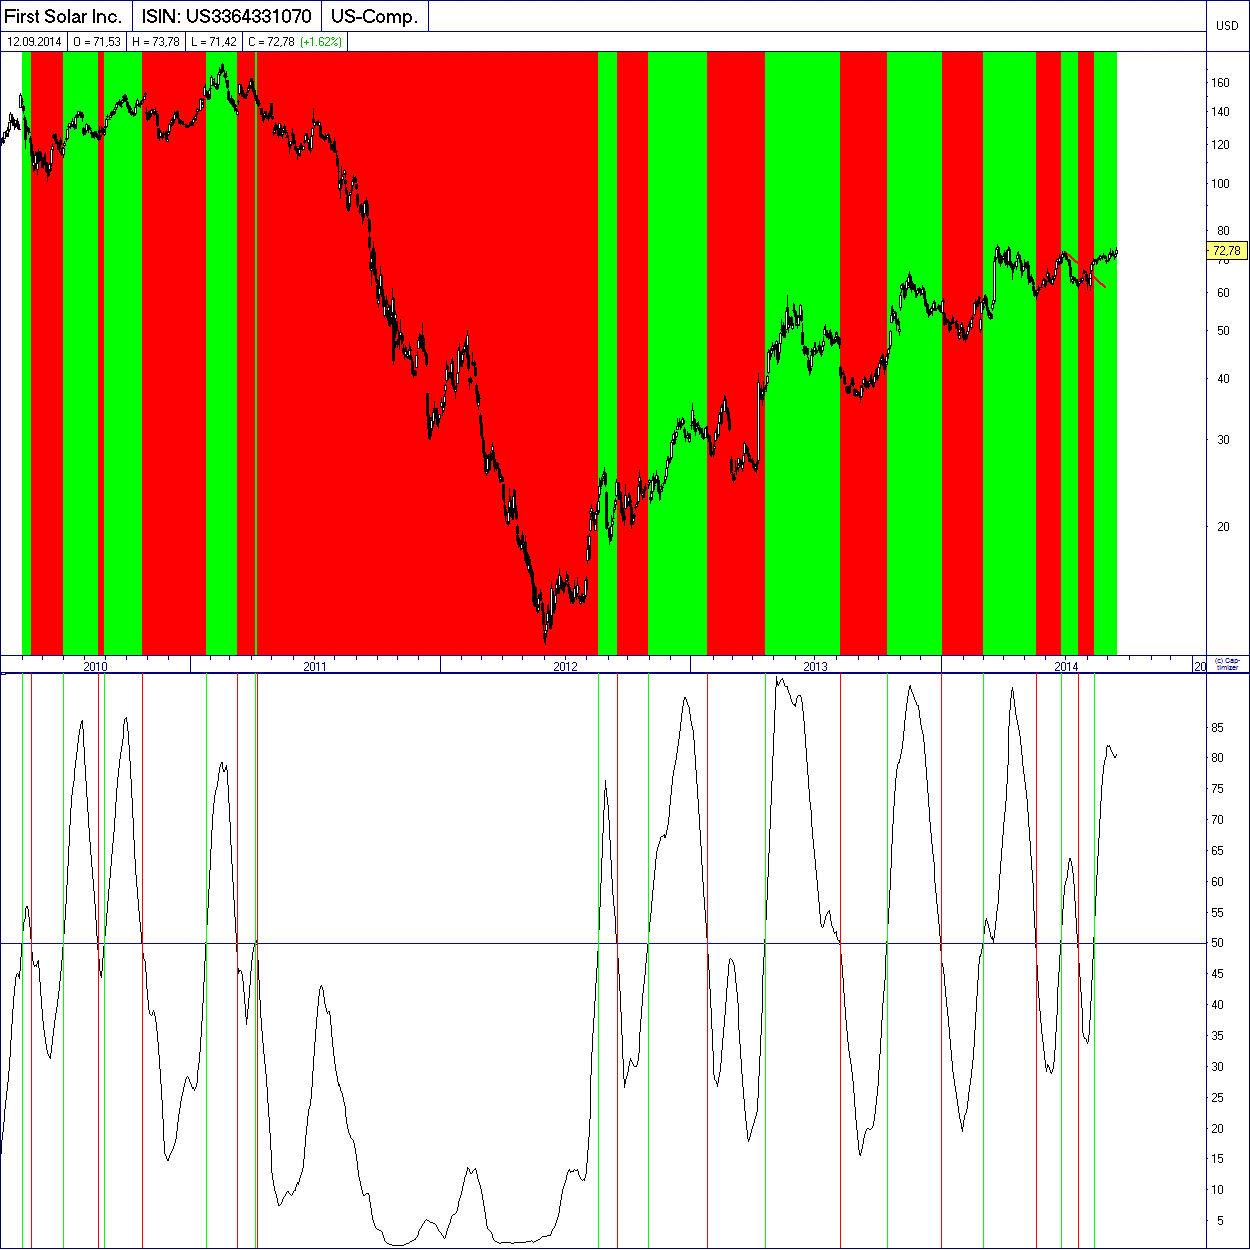
| Figure 4. The long-term picture shows buy & sell-signals on the basis of a ranking-indicator. The stock price already generated a long-signal two months ago. |
| Graphic provided by: www.captimizer.de. |
| |
| In Figure 4 you see the price chart with a ranking-indicator in the subchart below. The ranking indicator compares the stock with 4200 stocks traded on American exchanges, calculated on the basis of relative strength. The indicator is averaged by a period of 20 days. A stand over 50% means that the stock is in the top half of those 4200 stocks and therefore a favorite among investors. The red and green marked areas on the price chart identify crossings of the indicator with the 50% band. Right now First Solar belongs to the strongest 20 percent of the universe of US stocks. Assuming this status remains, the price target is likely to be reached. |
Thomas Bopp has more than 25 years experience in all kinds of trading. He mainly trades options on the short-side based on his own unique trading systems. He is also responsible for a German and Spanish free daily market newsletter, which covers the S&P 500, Ibex 35, DAX and German Bund-Future.
| Title: | Freelance trader and analyst |
| Company: | Bopp's Financial Market Studies |
| Address: | Eichendorffweg 6 |
| 61194 Niddatal, Germany, 61194 | |
| Phone # for sales: | +49 60347961 |
| E-mail address: | webmaster@zyklusanalyst.de |
Traders' Resource Links | |
| Bopp's Financial Market Studies has not added any product or service information to TRADERS' RESOURCE. | |
Click here for more information about our publications!
Comments

Request Information From Our Sponsors
- StockCharts.com, Inc.
- Candle Patterns
- Candlestick Charting Explained
- Intermarket Technical Analysis
- John Murphy on Chart Analysis
- John Murphy's Chart Pattern Recognition
- John Murphy's Market Message
- MurphyExplainsMarketAnalysis-Intermarket Analysis
- MurphyExplainsMarketAnalysis-Visual Analysis
- StockCharts.com
- Technical Analysis of the Financial Markets
- The Visual Investor
- VectorVest, Inc.
- Executive Premier Workshop
- One-Day Options Course
- OptionsPro
- Retirement Income Workshop
- Sure-Fire Trading Systems (VectorVest, Inc.)
- Trading as a Business Workshop
- VectorVest 7 EOD
- VectorVest 7 RealTime/IntraDay
- VectorVest AutoTester
- VectorVest Educational Services
- VectorVest OnLine
- VectorVest Options Analyzer
- VectorVest ProGraphics v6.0
- VectorVest ProTrader 7
- VectorVest RealTime Derby Tool
- VectorVest Simulator
- VectorVest Variator
- VectorVest Watchdog