HOT TOPICS LIST
- MACD
- Fibonacci
- RSI
- Gann
- ADXR
- Stochastics
- Volume
- Triangles
- Futures
- Cycles
- Volatility
- ZIGZAG
- MESA
- Retracement
- Aroon
INDICATORS LIST
LIST OF TOPICS
PRINT THIS ARTICLE
by Koos van der Merwe
When a head & shoulders pattern looks as though it is forming, do you sell the share or wait for the pattern to finalize before selling?
Position: Accumulate
Koos van der Merwe
Has been a technical analyst since 1969, and has worked as a futures and options trader with First Financial Futures in Johannesburg, South Africa.
PRINT THIS ARTICLE
HEAD & SHOULDERS
A Developing Head & Shoulders Formation
09/18/14 06:30:36 PMby Koos van der Merwe
When a head & shoulders pattern looks as though it is forming, do you sell the share or wait for the pattern to finalize before selling?
Position: Accumulate
| Hatteras Financial (HTS) is an externally-managed mortgage REIT formed in 2007 to invest in single-family residential mortgage securities issued or guaranteed by US Government agencies such as Fannie Mae (FNMA), Freddie Mac (FHLMC), or Ginnie Mae (GNMA). The company began operation in November 2007, with an initial private offering. The company elected to be taxed as a REIT and distributes its income to stockholders. On September 10, 2014 the company declared a quarterly dividend of $0.50 per common share for the third quarter of 2014, to be paid on October 24, 2014 to shareholders of record on September 22, 2014 (ex-dividend date September 18, 2014). |

|
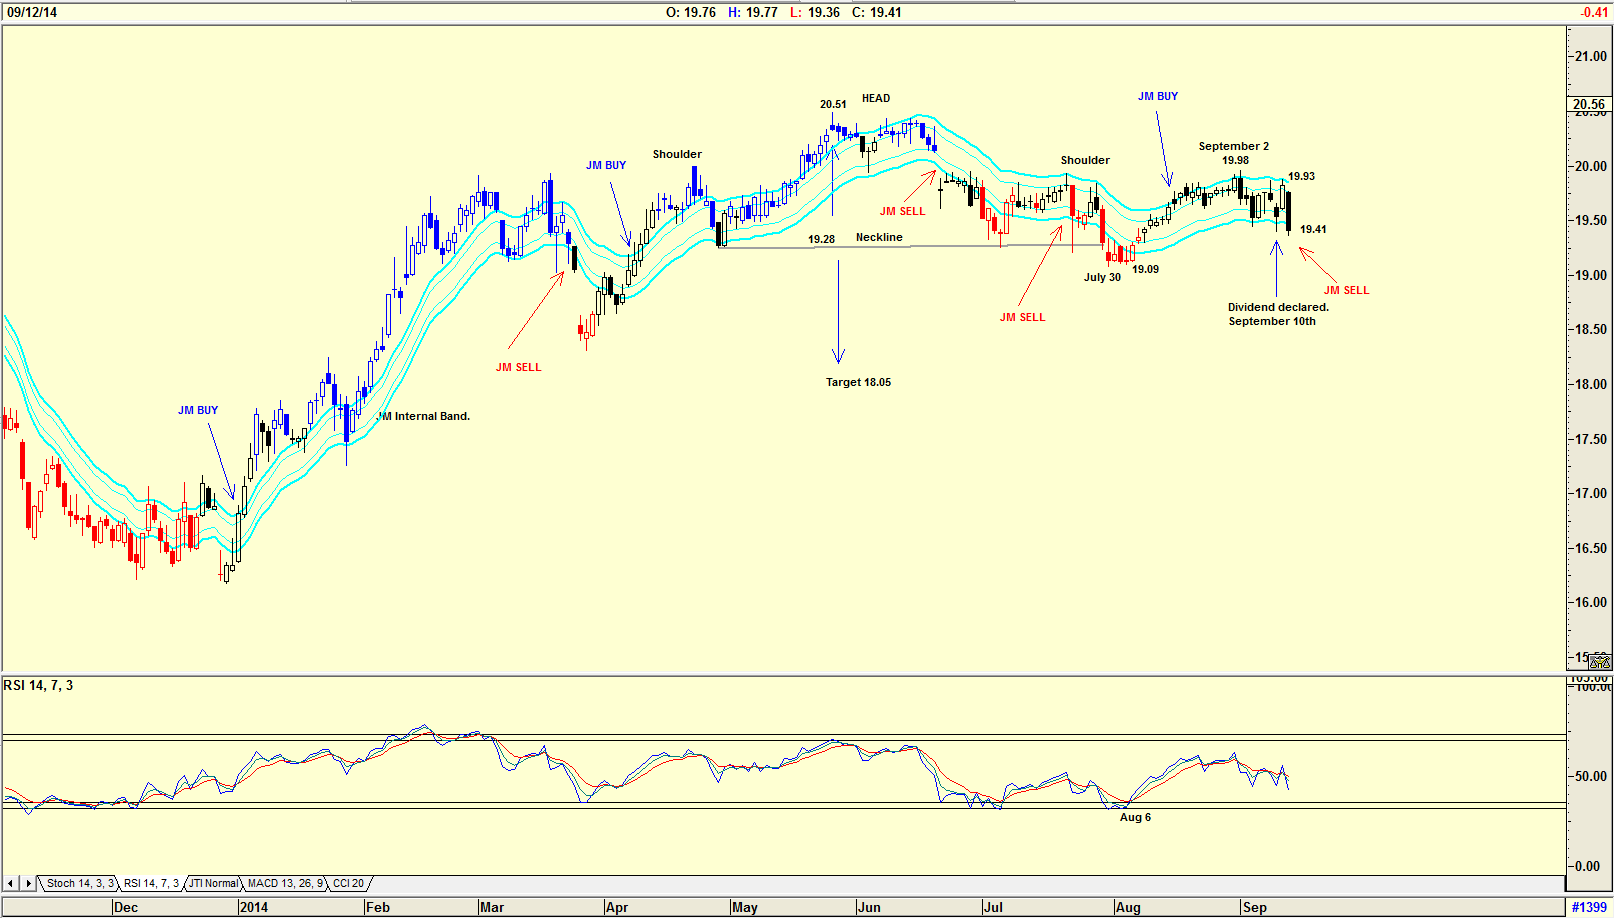
| Figure 1. Daily chart showing a head and shoulders pattern. |
| Graphic provided by: AdvancedGET. |
| |
| The chart in Figure 1 is a daily chart showing the possible formation of the head & shoulders pattern. On July 30, 2014 the share price broke below the neckline of $19.28 suggesting a target of $18.05. (20.51-19.28=1.23. 19.28-1.23=18.05). The share price fell to $19.09, formed a base, and then rose to $19.98 by September 2, 2014. On September 10, 2014, the dividend was declared. The share price rose to $19.93 and then promptly fell to its present price of $19.41. With a dividend of $0.50 declared, this suggests a yield of 10.3%, if maintained. Why, then, the drop in share price? The yield is an attractive one. Has the possible head & shoulders formation scared investors? A strategy commonly used is to buy a share when an attractive dividend is declared and to sell it on the date of record. Many investors however will hold the share until the date paid, and only then sell the share. This means that you should buy the share now, and sell it on September 22, 2014. The chart also shows a JM Internal Band indicator. The JM Internal band is a 15-period simple moving average offset by 2% positive and 2% negative. A buy signal is triggered when the price breaks above the upper band, and a sell signal is triggered when the price breaks below the lower band. At $19.41 as the share price fell on September 11, 2014, a JM Internal Band sell signal was triggered. Finally, note the relative strength index (RSI) which gave a buy signal on August 6, 2014, rose, and then fell back. |

|
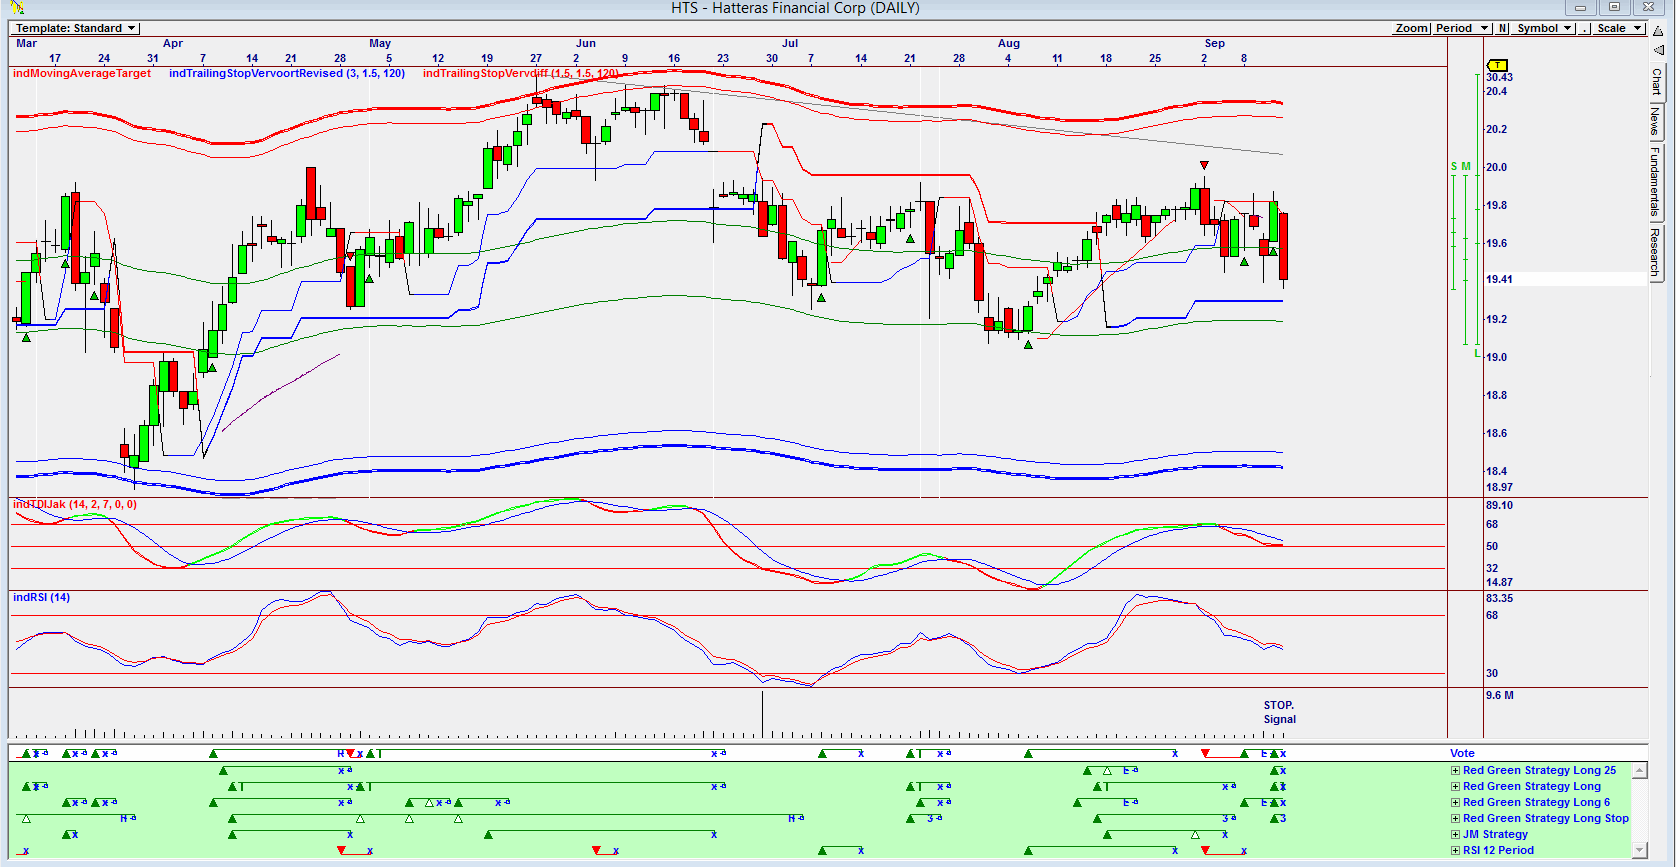
| Figure 2. Daily Omnitrader chart showing a stop signal given on September 12, 2014. |
| Graphic provided by: Omnitrader. |
| |
| The chart in Figure 2 is an Omnitrader chart showing a stop signal given on September 12, 2014 based on all the Red Green strategies below the Vote line. Was this because the dividend declared was less than expected? Note the previous history of the buy & sell signals. An attractive dividend, a falling share price, a possible head & shoulders pattern, and a JM Internal Band sell. Would I be a buyer of the share? Hmmm, I am in doubt because of the attractive dividend, but I feel that I should wait for a buy signal to be given either with the Omnitrader chart or with a JM Internal Band buy. Sometimes it pays to be cautious. |
Has been a technical analyst since 1969, and has worked as a futures and options trader with First Financial Futures in Johannesburg, South Africa.
| Address: | 3256 West 24th Ave |
| Vancouver, BC | |
| Phone # for sales: | 6042634214 |
| E-mail address: | petroosp@gmail.com |
Click here for more information about our publications!
PRINT THIS ARTICLE

|

Request Information From Our Sponsors
- StockCharts.com, Inc.
- Candle Patterns
- Candlestick Charting Explained
- Intermarket Technical Analysis
- John Murphy on Chart Analysis
- John Murphy's Chart Pattern Recognition
- John Murphy's Market Message
- MurphyExplainsMarketAnalysis-Intermarket Analysis
- MurphyExplainsMarketAnalysis-Visual Analysis
- StockCharts.com
- Technical Analysis of the Financial Markets
- The Visual Investor
- VectorVest, Inc.
- Executive Premier Workshop
- One-Day Options Course
- OptionsPro
- Retirement Income Workshop
- Sure-Fire Trading Systems (VectorVest, Inc.)
- Trading as a Business Workshop
- VectorVest 7 EOD
- VectorVest 7 RealTime/IntraDay
- VectorVest AutoTester
- VectorVest Educational Services
- VectorVest OnLine
- VectorVest Options Analyzer
- VectorVest ProGraphics v6.0
- VectorVest ProTrader 7
- VectorVest RealTime Derby Tool
- VectorVest Simulator
- VectorVest Variator
- VectorVest Watchdog
