HOT TOPICS LIST
- MACD
- Fibonacci
- RSI
- Gann
- ADXR
- Stochastics
- Volume
- Triangles
- Futures
- Cycles
- Volatility
- ZIGZAG
- MESA
- Retracement
- Aroon
INDICATORS LIST
LIST OF TOPICS
PRINT THIS ARTICLE
by Koos van der Merwe
Even when a market is correcting, there will be some equities going against the trend. TD Ameritrade (AMTD) is one of the stocks worth looking at.
Position: Buy
Koos van der Merwe
Has been a technical analyst since 1969, and has worked as a futures and options trader with First Financial Futures in Johannesburg, South Africa.
PRINT THIS ARTICLE
TECHNICAL ANALYSIS
TD Ameritrade Holding Corp.
09/17/14 03:24:53 PMby Koos van der Merwe
Even when a market is correcting, there will be some equities going against the trend. TD Ameritrade (AMTD) is one of the stocks worth looking at.
Position: Buy
| TD Ameritrade (AMTD) provides brokerage services to investors and traders predominantly via the Internet. The company provides touch-tone trading, trading over the internet, unlimited streaming, free real-time quotes, extended trading hours, and a commitment to speed of execution. The company contracts with an external provider for futures clearing and also contracts with external providers to facilitate foreign exchange trading for clients. With a market that is trending in a bullish direction, and with more and more traders entering the playing field, is AMTD a stock worth holding? What do the charts say? |

|
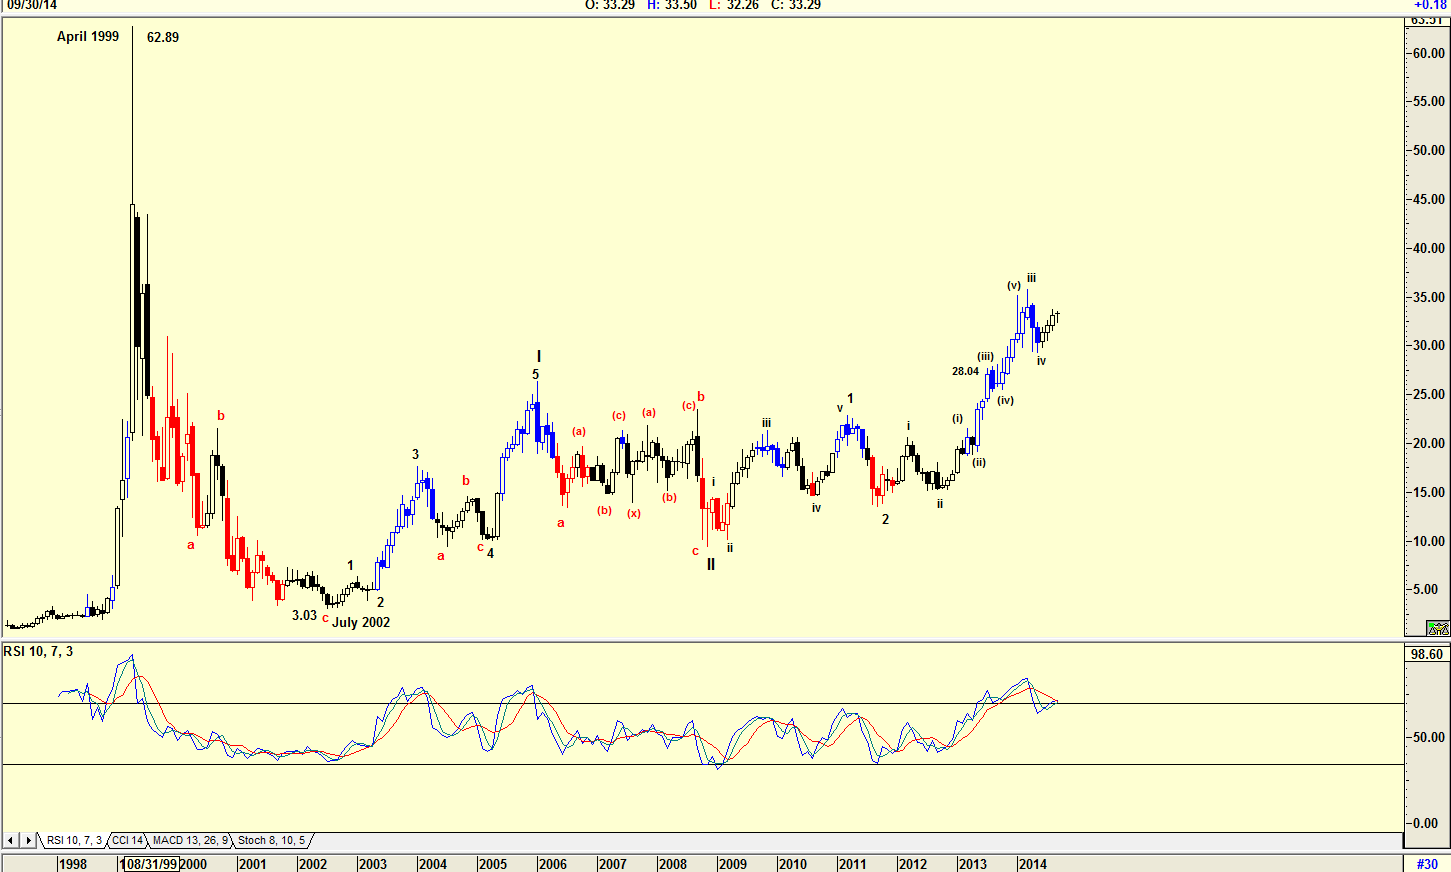
| Figure 1. Monthly chart with Elliott Wave count. |
| Graphic provided by: AdvancedGET. |
| |
| The chart in Figure 1 shows how the price fell from a high of $62.89 in April 1999 to a low of $3.03 by July 2002 as traders and investors fled the market when the technology bubble burst. The Elliott wave count on the chart is suggesting that the share is moving into a wave v of Wave 3 of a major WAVE III. The relative strength index (RSI), however, is suggesting that wave iv is not complete and has further downside. Should this happen, then the correction should fall to approximately $28, the 4th wave of lesser degree. |

|
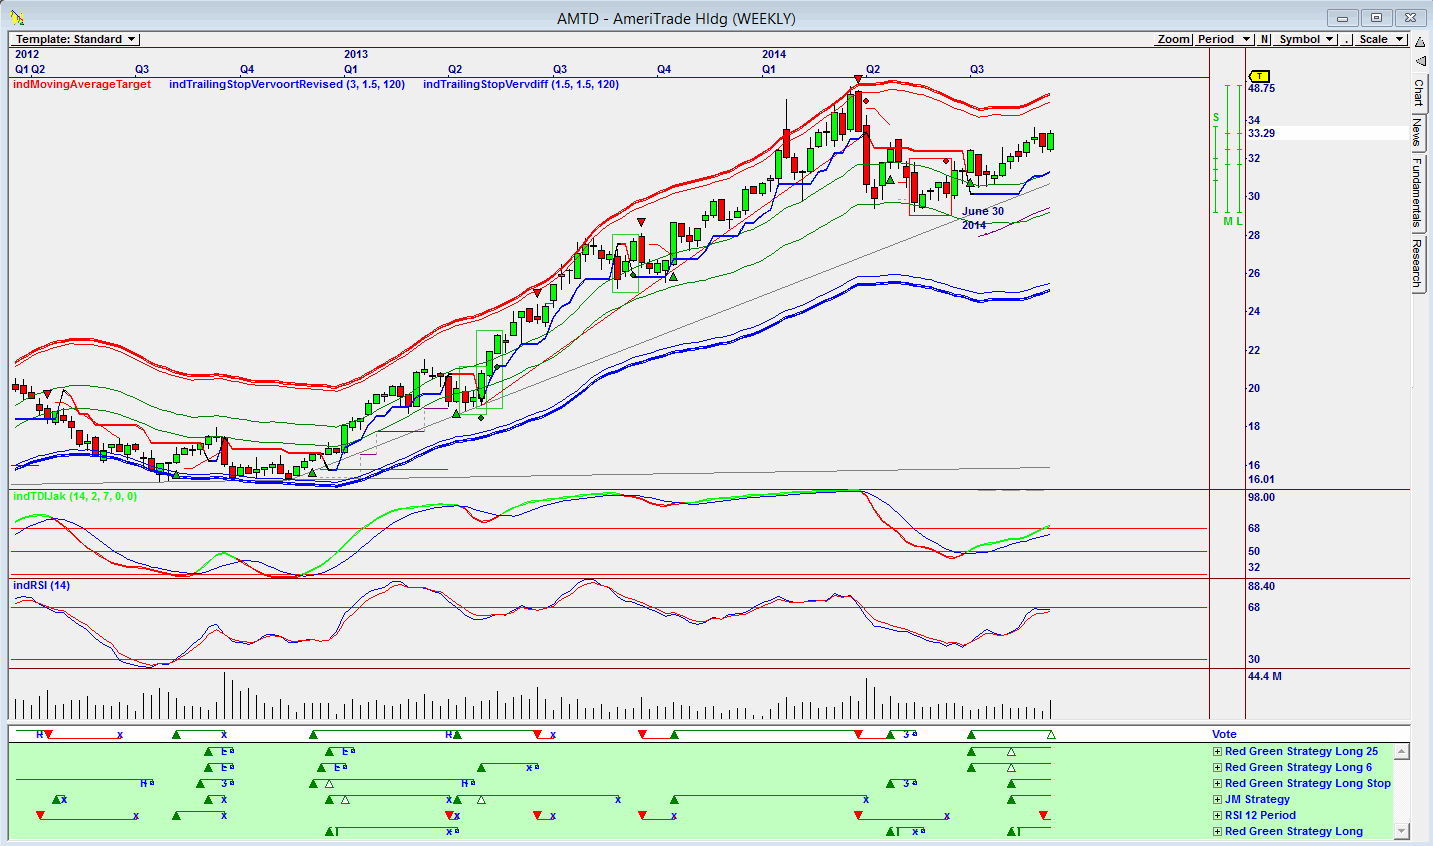
| Figure 2. Weekly Omnitrader chart showing a Vote line buy. |
| Graphic provided by: Omnitrader. |
| |
| The chart in Figure 2 is a weekly Omnitrader chart that shows a buy signal given in the Vote line on June 30, 2014 when the closing price was $32.24. The Vote line buy signal was triggered by the Red Green Strategy Long 25 and the Red Green Strategy Long 6. Note that both indicators are positive. |

|
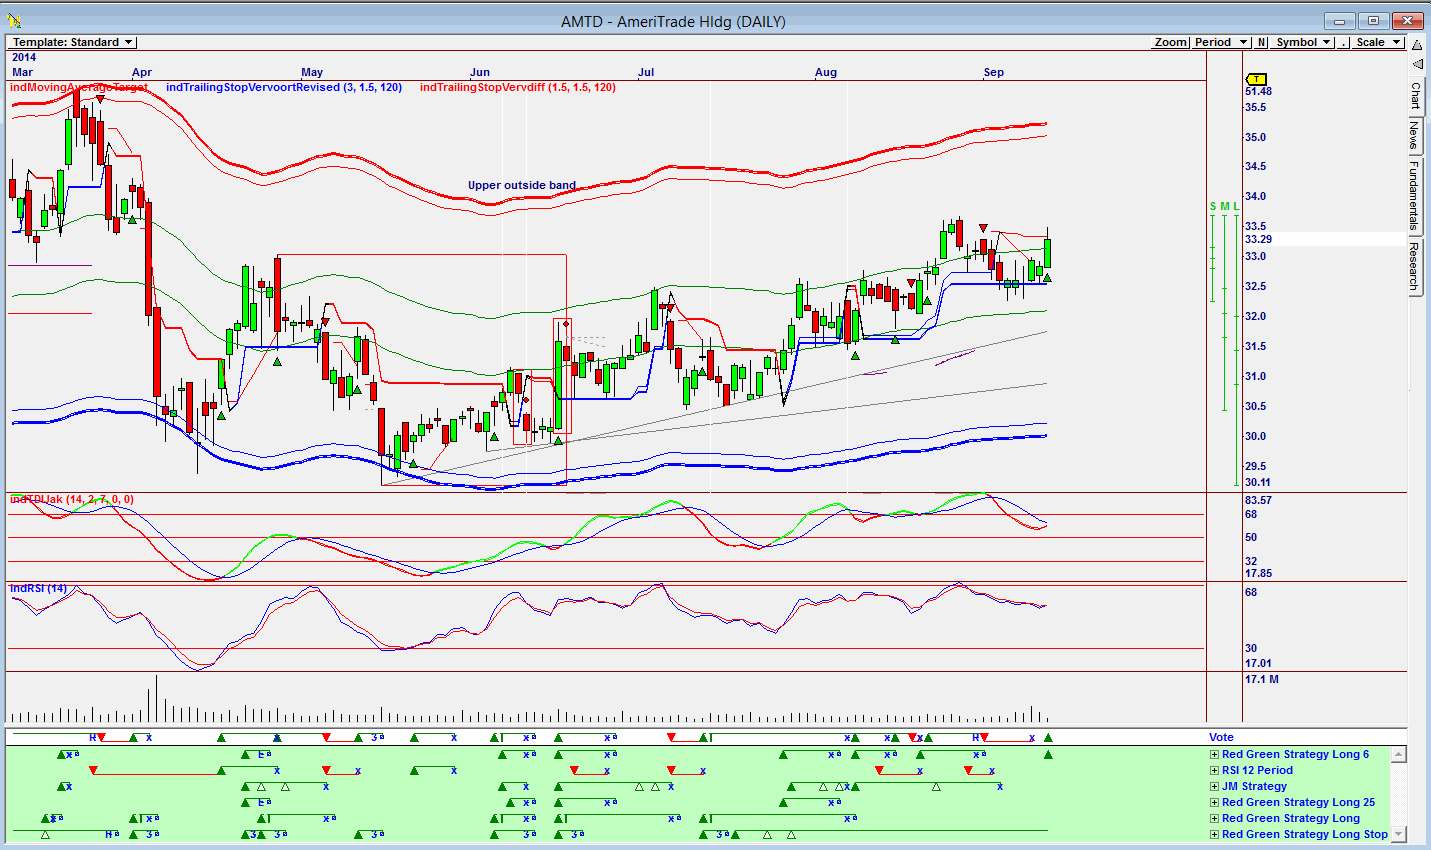
| Figure 3. Daily Omnitrader chart showing a Vote line buy signal. |
| Graphic provided by: Omnitrader. |
| |
| The chart in Figure 3 is a daily Omnitrader chart that brought the share to my attention. The Vote line shows a buy signal given by the result of the Red Green Strategy Long stop and Long 6. Both indicators are suggesting a buy is in the offing. With a target in the region of $35, the upper outside band or higher, and with the trend showing strength, a buy is in the cards. I would be a buyer of AMTD, but with stops that are close. As the market recovers after the present correction, more traders will start entering the market and the company will benefit. |
Has been a technical analyst since 1969, and has worked as a futures and options trader with First Financial Futures in Johannesburg, South Africa.
| Address: | 3256 West 24th Ave |
| Vancouver, BC | |
| Phone # for sales: | 6042634214 |
| E-mail address: | petroosp@gmail.com |
Click here for more information about our publications!
PRINT THIS ARTICLE

Request Information From Our Sponsors
- StockCharts.com, Inc.
- Candle Patterns
- Candlestick Charting Explained
- Intermarket Technical Analysis
- John Murphy on Chart Analysis
- John Murphy's Chart Pattern Recognition
- John Murphy's Market Message
- MurphyExplainsMarketAnalysis-Intermarket Analysis
- MurphyExplainsMarketAnalysis-Visual Analysis
- StockCharts.com
- Technical Analysis of the Financial Markets
- The Visual Investor
- VectorVest, Inc.
- Executive Premier Workshop
- One-Day Options Course
- OptionsPro
- Retirement Income Workshop
- Sure-Fire Trading Systems (VectorVest, Inc.)
- Trading as a Business Workshop
- VectorVest 7 EOD
- VectorVest 7 RealTime/IntraDay
- VectorVest AutoTester
- VectorVest Educational Services
- VectorVest OnLine
- VectorVest Options Analyzer
- VectorVest ProGraphics v6.0
- VectorVest ProTrader 7
- VectorVest RealTime Derby Tool
- VectorVest Simulator
- VectorVest Variator
- VectorVest Watchdog
