

HOT TOPICS LIST
- MACD
- Fibonacci
- RSI
- Gann
- ADXR
- Stochastics
- Volume
- Triangles
- Futures
- Cycles
- Volatility
- ZIGZAG
- MESA
- Retracement
- Aroon
INDICATORS LIST
LIST OF TOPICS
PRINT THIS ARTICLE
by Donald W. Pendergast, Jr.
When a stock trends higher even as its money flow histogram keeps making lower highs, it's usually a warning that the "smart money" are in the process of scaling out prior to a correction. Here's a look at this process in action in shares of Spirit Airlines, Inc.
Position: N/A
Donald W. Pendergast, Jr.
Freelance financial markets writer and online publisher of the Trendzetterz.com S&P 500 Weekly Forecast service.
PRINT THIS ARTICLE
ACCUM./DIST. CHAIKIN
SAVE: Distribution Warns Of Correction
09/17/14 03:21:01 PMby Donald W. Pendergast, Jr.
When a stock trends higher even as its money flow histogram keeps making lower highs, it's usually a warning that the "smart money" are in the process of scaling out prior to a correction. Here's a look at this process in action in shares of Spirit Airlines, Inc.
Position: N/A
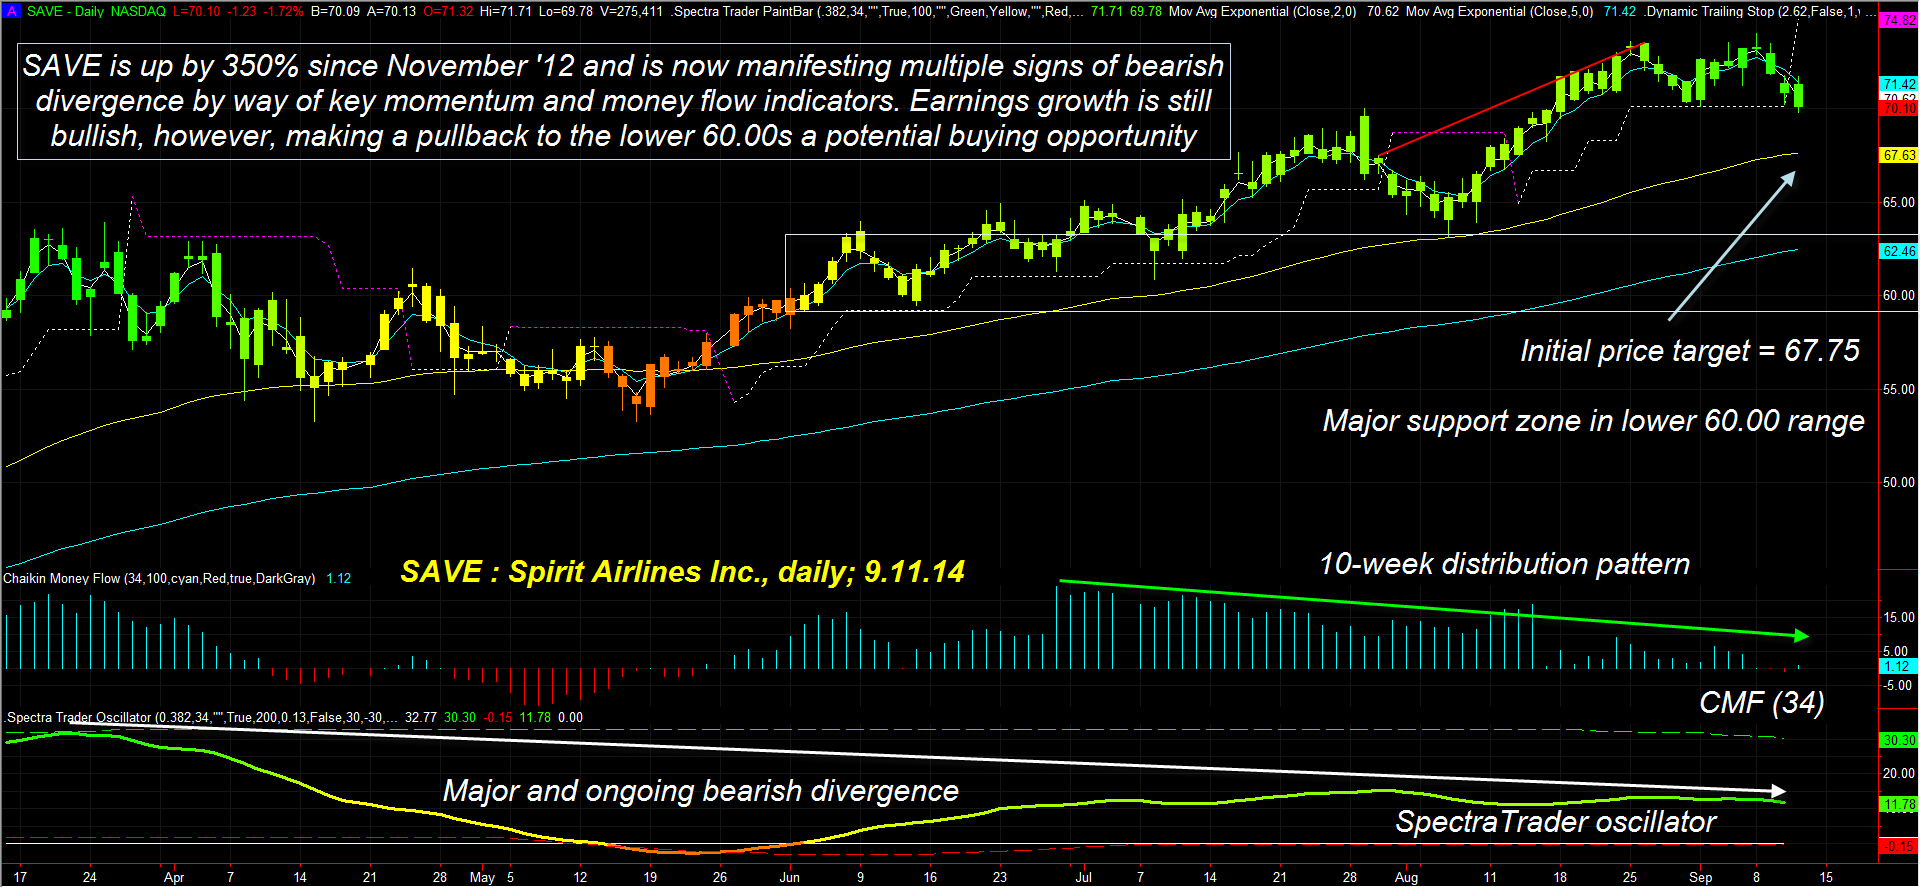
| The major rally seen in the US stock market since mid-November 2012 has been one of the strongest and most persistent on record; one of the best performers during this 22-month period has been Spirit Airlines, Inc. (SAVE), which was up as much as 373% between November 14, 2012 and September 8, 2014 — an average monthly gain of approximately 17.11 percent (Figure 1). There have been several corrections during the rally, but each one was contained by the blue 131-day exponential moving average (EMA); in fact, SAVE has also remained above its 60-day EMA for most of the bullish run. This particular moving average pair does a good job of defining the primary trend in liquid stocks and exchange traded funds (ETFs); try it on the equities you trade and invest in and see if it doesn't help you better time your long and short trade entries. The spread between the two averages is still wide and stable (as it invariably will be at all major highs and lows) but here are several major 'heads up' warnings being given by other indicators: 1. The SpectraTrader oscillator (bottom of chart) is manifesting a major bearish divergence against a previous major swing high (March '14) 2. The same oscillator just gave another bearish warning by turning lower even as SAVE hit 74.00 - its all-time high price. 3. The 34-week Chaikin Money Flow histogram is manifesting an alarming bearish money flow divergence. 4. On the daily chart, the 34-, 55- and 89-day money flow histogram is also confirming that distribution has been underway for the last ten weeks. |
|
| Figure 1. Spirit Airlines Inc. (SAVE) is likely in the beginning of another correction, one that has been warned of by numerous divergences on its daily and weekly charts. |
| Graphic provided by: TradeStation. |
| Graphic provided by: Elite Trader Indicators by Fibozachi.com. |
| |
| Can SAVE still move even higher? Certainly it can, but the probabilities favor a substantial correction sooner rather than later, based on the above technical dynamics. Existing longs should be preparing a possible exit strategy if they have open gains they'd like to hold on to. Those still convinced of even more upside in SAVE would do well to buy protective puts to stave off the deleterious effects of a sudden correction in the stock. |
|
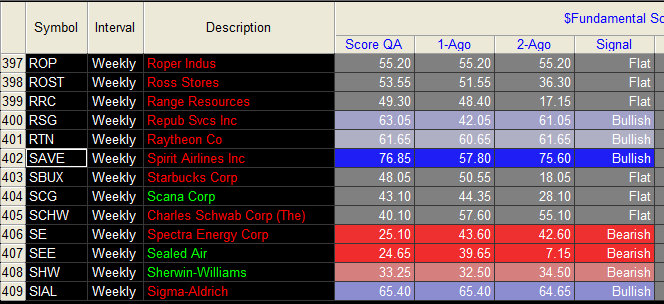
| Figure 2. SAVE's fundamental ranking is still in the bullish category, suggesting that the stock may be an attractive buy should it decline into a major support zone in the lower 60.00 range. |
| Graphic provided by: TradeStation. |
| Graphic provided by: TradeStation RadarScreen. |
| |
| Now, lest readers assume a horribly bearish long-term outlook for SAVE, be aware that's not the case — yet. The stock still has excellent earnings growth and also offers a potential buying opportunity once it corrects into the lower 60.00 range (horizontal box on chart). There is also a minor support zone near the yellow 60-day EMA at 67.80 and that should see at least a minor bounce should this emerging sell-off get underway as expected. A close below the yellow EMA sets up a high probability decline to at least 63.00, after which savvy traders can begin to look for suitable long re-entry areas. All the broad markets need to start a noticeable correction, and if the long overdue correction in the major US indexes is at hand SAVE should also descend to either of the two support zones mentioned. Trade wisely until we meet here again. |
Freelance financial markets writer and online publisher of the Trendzetterz.com S&P 500 Weekly Forecast service.
| Title: | Market consultant and writer |
| Company: | Trendzetterz |
| Address: | 81 Hickory Hollow Drive |
| Crossville, TN 38555 | |
| Phone # for sales: | 904-303-4814 |
| Website: | trendzetterz.com |
| E-mail address: | support@trendzetterz.com |
Traders' Resource Links | |
| Trendzetterz has not added any product or service information to TRADERS' RESOURCE. | |
Click here for more information about our publications!
PRINT THIS ARTICLE

Request Information From Our Sponsors
- VectorVest, Inc.
- Executive Premier Workshop
- One-Day Options Course
- OptionsPro
- Retirement Income Workshop
- Sure-Fire Trading Systems (VectorVest, Inc.)
- Trading as a Business Workshop
- VectorVest 7 EOD
- VectorVest 7 RealTime/IntraDay
- VectorVest AutoTester
- VectorVest Educational Services
- VectorVest OnLine
- VectorVest Options Analyzer
- VectorVest ProGraphics v6.0
- VectorVest ProTrader 7
- VectorVest RealTime Derby Tool
- VectorVest Simulator
- VectorVest Variator
- VectorVest Watchdog
- StockCharts.com, Inc.
- Candle Patterns
- Candlestick Charting Explained
- Intermarket Technical Analysis
- John Murphy on Chart Analysis
- John Murphy's Chart Pattern Recognition
- John Murphy's Market Message
- MurphyExplainsMarketAnalysis-Intermarket Analysis
- MurphyExplainsMarketAnalysis-Visual Analysis
- StockCharts.com
- Technical Analysis of the Financial Markets
- The Visual Investor