

HOT TOPICS LIST
- MACD
- Fibonacci
- RSI
- Gann
- ADXR
- Stochastics
- Volume
- Triangles
- Futures
- Cycles
- Volatility
- ZIGZAG
- MESA
- Retracement
- Aroon
INDICATORS LIST
LIST OF TOPICS
PRINT THIS ARTICLE
by Billy Williams
HCLP has been on the rise but has recently stalled so is it time to exit or go long? The answer may surprise you.
Position: N/A
Billy Williams
Billy Williams has been trading the markets for 27 years, specializing in momentum trading with stocks and options.
PRINT THIS ARTICLE
VOLUME
Convergence Of Bullish Signals In HCLP
09/17/14 03:10:15 PMby Billy Williams
HCLP has been on the rise but has recently stalled so is it time to exit or go long? The answer may surprise you.
Position: N/A
| Small-cap companies don't attract a lot of attention by traders because of their size but that's their loss and your gain. Small caps have the ability to react quickly to the marketplace, they can innovate faster than larger companies weighted down by bureaucracy, and generate huge returns in the form of earnings and profits to their shareholders. They also make attractive targets for larger companies that might look to acquire them to improve their own earnings by adding a smaller company to their portfolio. In competitive markets, the ability to act quickly and serve the needs of their customers is a huge competitive advantage. Here's one company that has emerged as a potential leader in an industry that is fueling the world's economy by servicing the major players in that field. Hi-Crush Partners LP (HCLP) operates as a producer and supplier of monocrystalline sand. Monocrystalline sand is a mineral that is used as a "proppant" to enhance the recovery rates of hydrocarbons from oil and natural gas wells. |
|
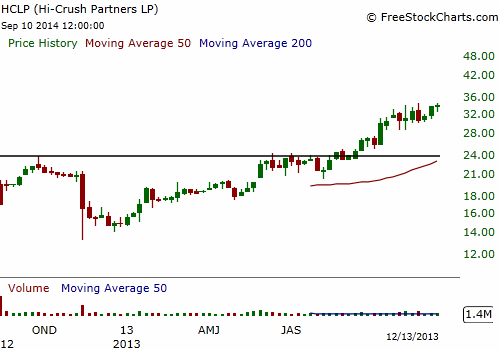
| Figure 1. HCLP went public two years ago and had a rocky start as the stock fell apart. After bottoming at $13.21, the stock began to rally and hasn't looked back. |
| Graphic provided by: www.freestockcharts.com. |
| |
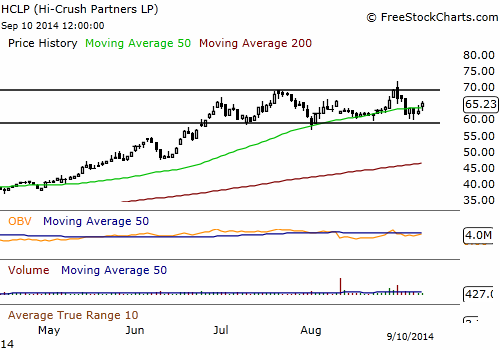
| HCLP had a rocky start in November of 2012, where price fell on a huge gap and dropped to an all-time low of $13.21 (Figure 1). From there, the stock found support and clawed back above its 50-day simple moving average (SMA) and went on to make a steady series of higher highs and higher lows. On May 28, 2013, HCLP managed to close the downward price gap that it suffered the year before in the same way it experienced it, through an explosive price gap to the upside. After the gap was closed, and on the tail-end of an explosive move to the upside, HCLP rallied hard and has hardly paused in its upward flight. From that point, HCLP has gone on to triple in price, trading as high as $67.69 but its bull run has stalled (Figure 2). Finding resistance at the $67 to $69 price level, the company has entered a period of price contraction and appears to be forming a base. From July 1, 2014 to present, the base has exceeded an eight-week time frame which is the standard time frame for a solid base pattern. A well-formed base pattern will act as a spring-board for the stock to breakout to higher ground presenting a huge opportunity for a skilled trader who recognizes it. |
|
| Figure 2. Despite HCLP's impressive performance and price trend, the stock has stalled recently. It has a number of things working for the bulls - trading at its highs, long-term trend, strong technical action - but volume has dropped. If HCLP can rally past its resistance point, then an entry at $67.79 would be in order but only if there is enough volume to fuel its rally. |
| Graphic provided by: www.freestockcharts.com. |
| |
| The OBV indicator reveals that institutional sponsorship is mixed which accounts for the stock trading in a tight range near its all-time price high. However, a breakout could occur by a rise in volume through institutional traders taking positions. In addition, HLCP's Bollinger Bands are trading within its Keltner Channels signaling a squeeze setup. With HCLP experiencing a phase of low volatility you could see volatility revert to its mean and price explode to higher ground. |
| HCLP has a number of things going for it — earnings, trading near its all-time highs, a squeeze setup — but this missing ingredient is sufficient volume to fuel its breakout to higher ground. That said, if a breakout occurs at the $67.79 entry point on a surge of volume in excess of 50% of its 50-day average volume then go long with a 7% stop. Sell half your position as the stock hits a price equal to your initial risk and then trail the rest of the position as the stock climbs higher and let the market take you out if your stop is hit. |
Billy Williams has been trading the markets for 27 years, specializing in momentum trading with stocks and options.
| Company: | StockOptionSystem.com |
| E-mail address: | stockoptionsystem.com@gmail.com |
Traders' Resource Links | |
| StockOptionSystem.com has not added any product or service information to TRADERS' RESOURCE. | |
Click here for more information about our publications!
PRINT THIS ARTICLE

Request Information From Our Sponsors
- StockCharts.com, Inc.
- Candle Patterns
- Candlestick Charting Explained
- Intermarket Technical Analysis
- John Murphy on Chart Analysis
- John Murphy's Chart Pattern Recognition
- John Murphy's Market Message
- MurphyExplainsMarketAnalysis-Intermarket Analysis
- MurphyExplainsMarketAnalysis-Visual Analysis
- StockCharts.com
- Technical Analysis of the Financial Markets
- The Visual Investor
- VectorVest, Inc.
- Executive Premier Workshop
- One-Day Options Course
- OptionsPro
- Retirement Income Workshop
- Sure-Fire Trading Systems (VectorVest, Inc.)
- Trading as a Business Workshop
- VectorVest 7 EOD
- VectorVest 7 RealTime/IntraDay
- VectorVest AutoTester
- VectorVest Educational Services
- VectorVest OnLine
- VectorVest Options Analyzer
- VectorVest ProGraphics v6.0
- VectorVest ProTrader 7
- VectorVest RealTime Derby Tool
- VectorVest Simulator
- VectorVest Variator
- VectorVest Watchdog