HOT TOPICS LIST
- MACD
- Fibonacci
- RSI
- Gann
- ADXR
- Stochastics
- Volume
- Triangles
- Futures
- Cycles
- Volatility
- ZIGZAG
- MESA
- Retracement
- Aroon
INDICATORS LIST
LIST OF TOPICS
PRINT THIS ARTICLE
by Koos van der Merwe
The share price of Starbucks appears to be stagnating. Is the share worth a buy?
Position: Accumulate
Koos van der Merwe
Has been a technical analyst since 1969, and has worked as a futures and options trader with First Financial Futures in Johannesburg, South Africa.
PRINT THIS ARTICLE
ELLIOTT WAVE
I Like My Starbucks Coffee
09/15/14 04:49:15 PMby Koos van der Merwe
The share price of Starbucks appears to be stagnating. Is the share worth a buy?
Position: Accumulate
| September is known to be the quietest month of the year, and because of this presents a good buying opportunity. However, knowing exactly when to buy is the challenge, especially when so many investors have the 'October hit' on their minds. Nevertheless, buying those stocks you have researched and would like to hold during the month of September has almost become a must, because the best months of the year are from November to May. So, keeping this in mind, look at the list of stocks you would like to own, and check the share price every day to look for that buying opportunity. I like Starbucks (SBUX). I enjoy their coffee and I enjoy eating their oat bars. I do not own the share at the moment, but I will definitely be a buyer this month once my charts suggest a buy. |

|
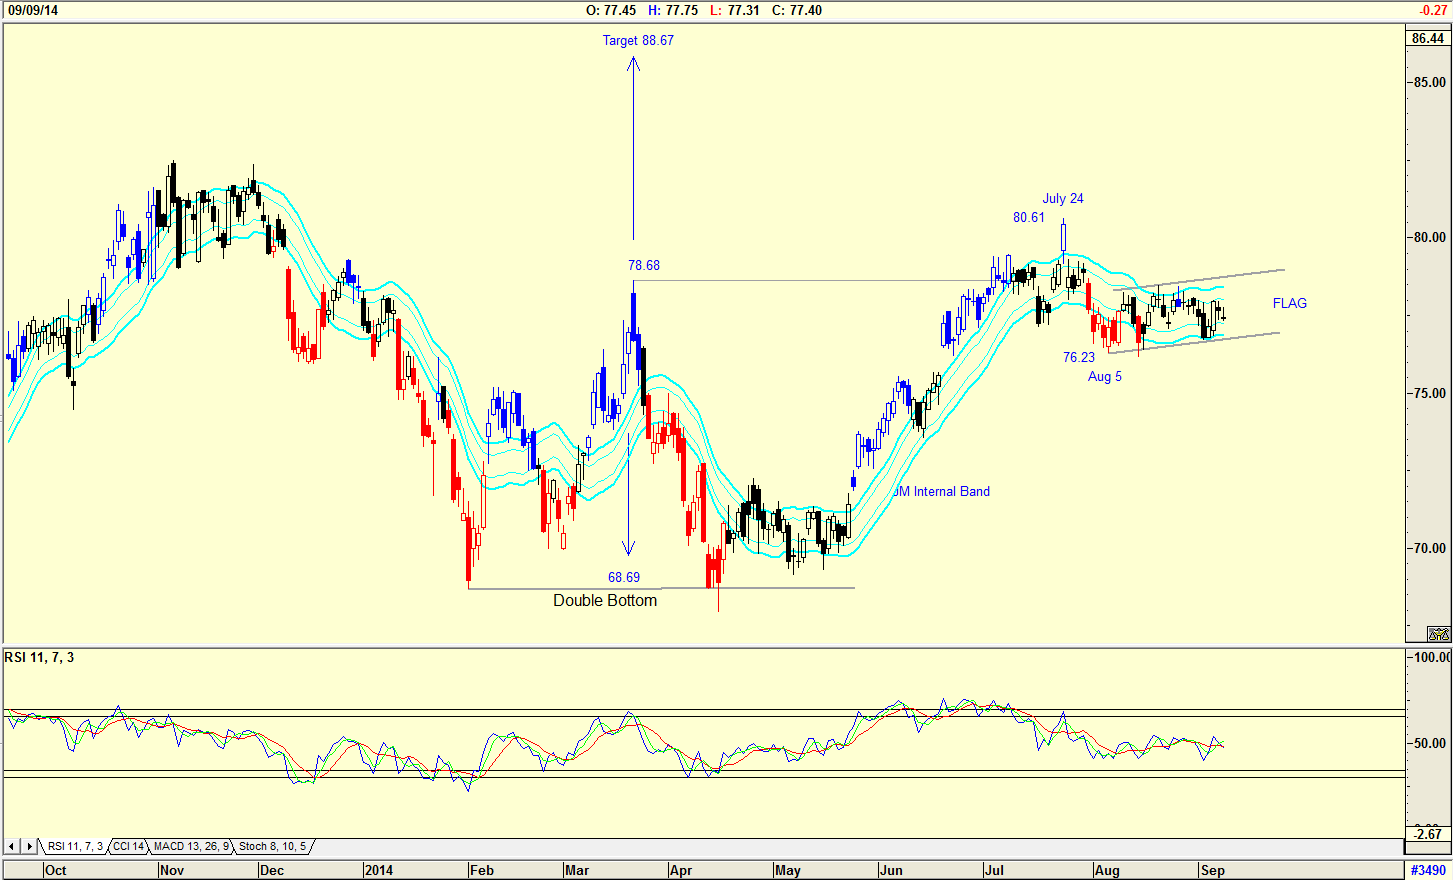
| Figure 1. Daily chart showing "W" formation. |
| Graphic provided by: AdvancedGET. |
| |
| The chart in Figure 1 is a daily chart showing the double bottom formation that appeared. Double bottom formations appear as a 'W' on a chart as shown. Many double bottom formations lead analysts to believe that a head & shoulders formation may have formed. However, you should never forgot that a head & shoulders formation always occurs at a top, and never after the share price has made a high and is correcting down. The target price suggested by the double bottom formation is $88.67. (78.68-68.69=9.99+78.68=88.67). The price rose to $80.61 by July 24, 2014 breaking above $78.68 suggesting that the share price could well rise to $88.67. However, the share price then fell to $76.23 as the relative strength index (RSI) fell, and has now formed a flag pattern in a downtrend suggesting that the price could fall lower. Note that the share price has not given a buy on the JM Internal Band indicator. The JM Internal Band is a 15-period simple moving average offset by 2% positive and 2% negative. A buy signal is given when the price breaks above the upper band, and a sell signal is triggered when the price breaks below the lower band. |

|
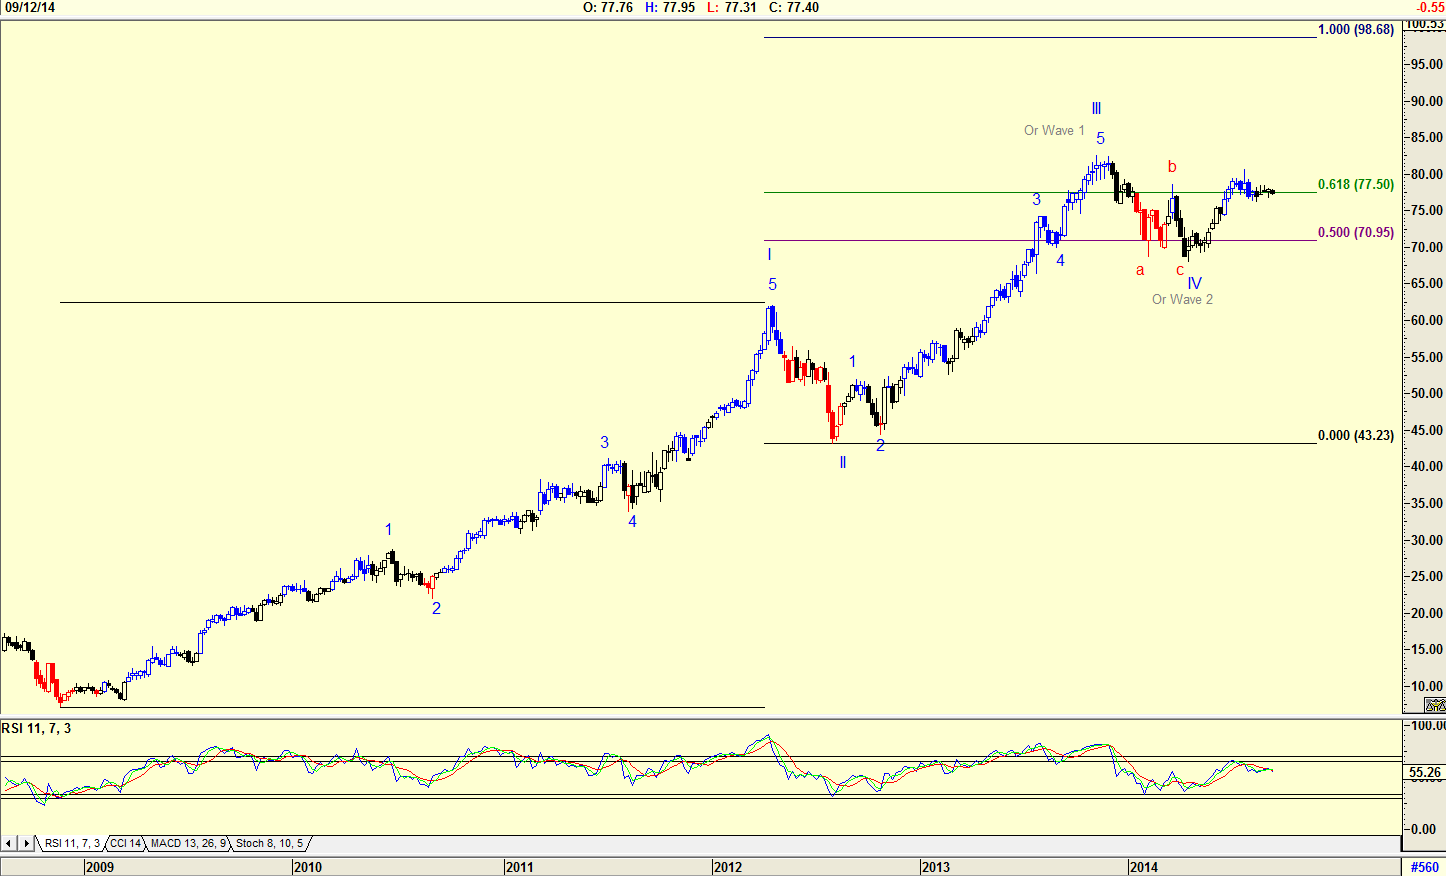
| Figure 2. Weekly chart with Elliott Wave count. |
| Graphic provided by: AdvancedGET. |
| |
| The chart in Figure 2 is a weekly chart with an Elliott Wave count suggesting that WAVE III is smaller than WAVE I. If this is truly the case, then WAVE V will be less than WAVE III in size. However, my Elliott Wave count could be wrong. The WAVE III shown on the chart could be Wave 1 of WAVE III and WAVE IV shown on the chart could be Wave 2 of WAVE III. If this is true, then the target for the share will be greater than $98.68, which is the price the share should reach if WAVE III = WAVE I. |

|
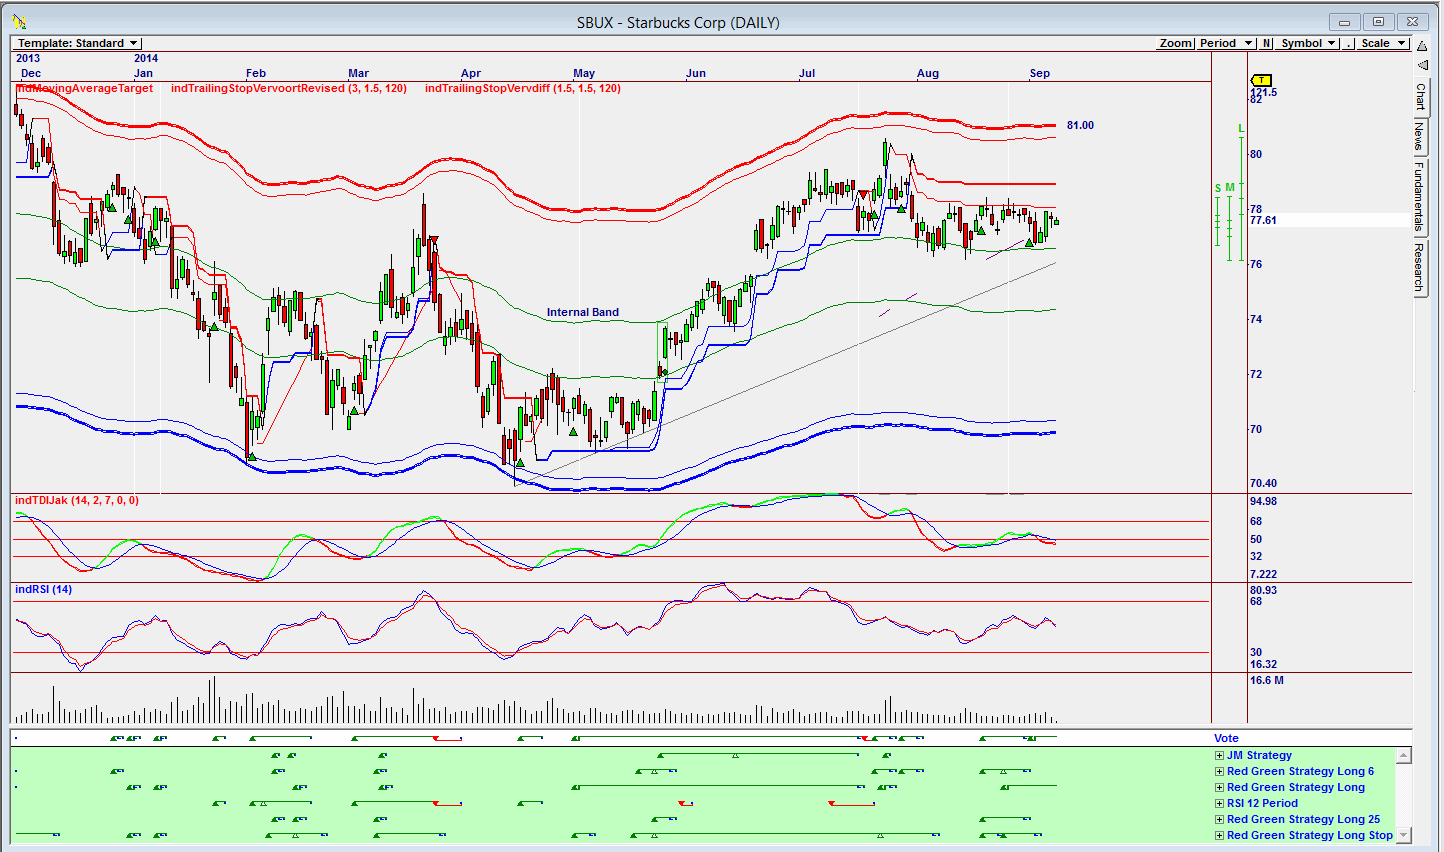
| Figure 3. Daily Omnitrader chart showing Vote line buy signals. |
| Graphic provided by: Omnitrader.. |
| |
| The chart in Figure 3 is an Omnitrader chart that shows buy signals on the Vote line. The buy signals are a summation of the strategies shown below the Vote line. Eyeballing the accuracy of the signals given, the share could be bought with a target, the upper band at $81.00. The share price seems to have found support on the upper internal band. Note that both indicators are trending down. As much as I would like to own SBUX, and in spite of the buy signal given by the chart in Figure 3, because it is September, I will be sitting on the sidelines waiting for a major correction that could trigger a new buy signal. |
Has been a technical analyst since 1969, and has worked as a futures and options trader with First Financial Futures in Johannesburg, South Africa.
| Address: | 3256 West 24th Ave |
| Vancouver, BC | |
| Phone # for sales: | 6042634214 |
| E-mail address: | petroosp@gmail.com |
Click here for more information about our publications!
PRINT THIS ARTICLE

Request Information From Our Sponsors
- VectorVest, Inc.
- Executive Premier Workshop
- One-Day Options Course
- OptionsPro
- Retirement Income Workshop
- Sure-Fire Trading Systems (VectorVest, Inc.)
- Trading as a Business Workshop
- VectorVest 7 EOD
- VectorVest 7 RealTime/IntraDay
- VectorVest AutoTester
- VectorVest Educational Services
- VectorVest OnLine
- VectorVest Options Analyzer
- VectorVest ProGraphics v6.0
- VectorVest ProTrader 7
- VectorVest RealTime Derby Tool
- VectorVest Simulator
- VectorVest Variator
- VectorVest Watchdog
- StockCharts.com, Inc.
- Candle Patterns
- Candlestick Charting Explained
- Intermarket Technical Analysis
- John Murphy on Chart Analysis
- John Murphy's Chart Pattern Recognition
- John Murphy's Market Message
- MurphyExplainsMarketAnalysis-Intermarket Analysis
- MurphyExplainsMarketAnalysis-Visual Analysis
- StockCharts.com
- Technical Analysis of the Financial Markets
- The Visual Investor
