

HOT TOPICS LIST
- MACD
- Fibonacci
- RSI
- Gann
- ADXR
- Stochastics
- Volume
- Triangles
- Futures
- Cycles
- Volatility
- ZIGZAG
- MESA
- Retracement
- Aroon
INDICATORS LIST
LIST OF TOPICS
PRINT THIS ARTICLE
by Donald W. Pendergast, Jr.
Shares of Alliance Data Systems (ADS) are heading lower after breaking a key support level.
Position: N/A
Donald W. Pendergast, Jr.
Freelance financial markets writer and online publisher of the Trendzetterz.com S&P 500 Weekly Forecast service.
PRINT THIS ARTICLE
FIBONACCI
Alliance Data Systems: Easy Short Into Support?
09/12/14 05:23:49 PMby Donald W. Pendergast, Jr.
Shares of Alliance Data Systems (ADS) are heading lower after breaking a key support level.
Position: N/A
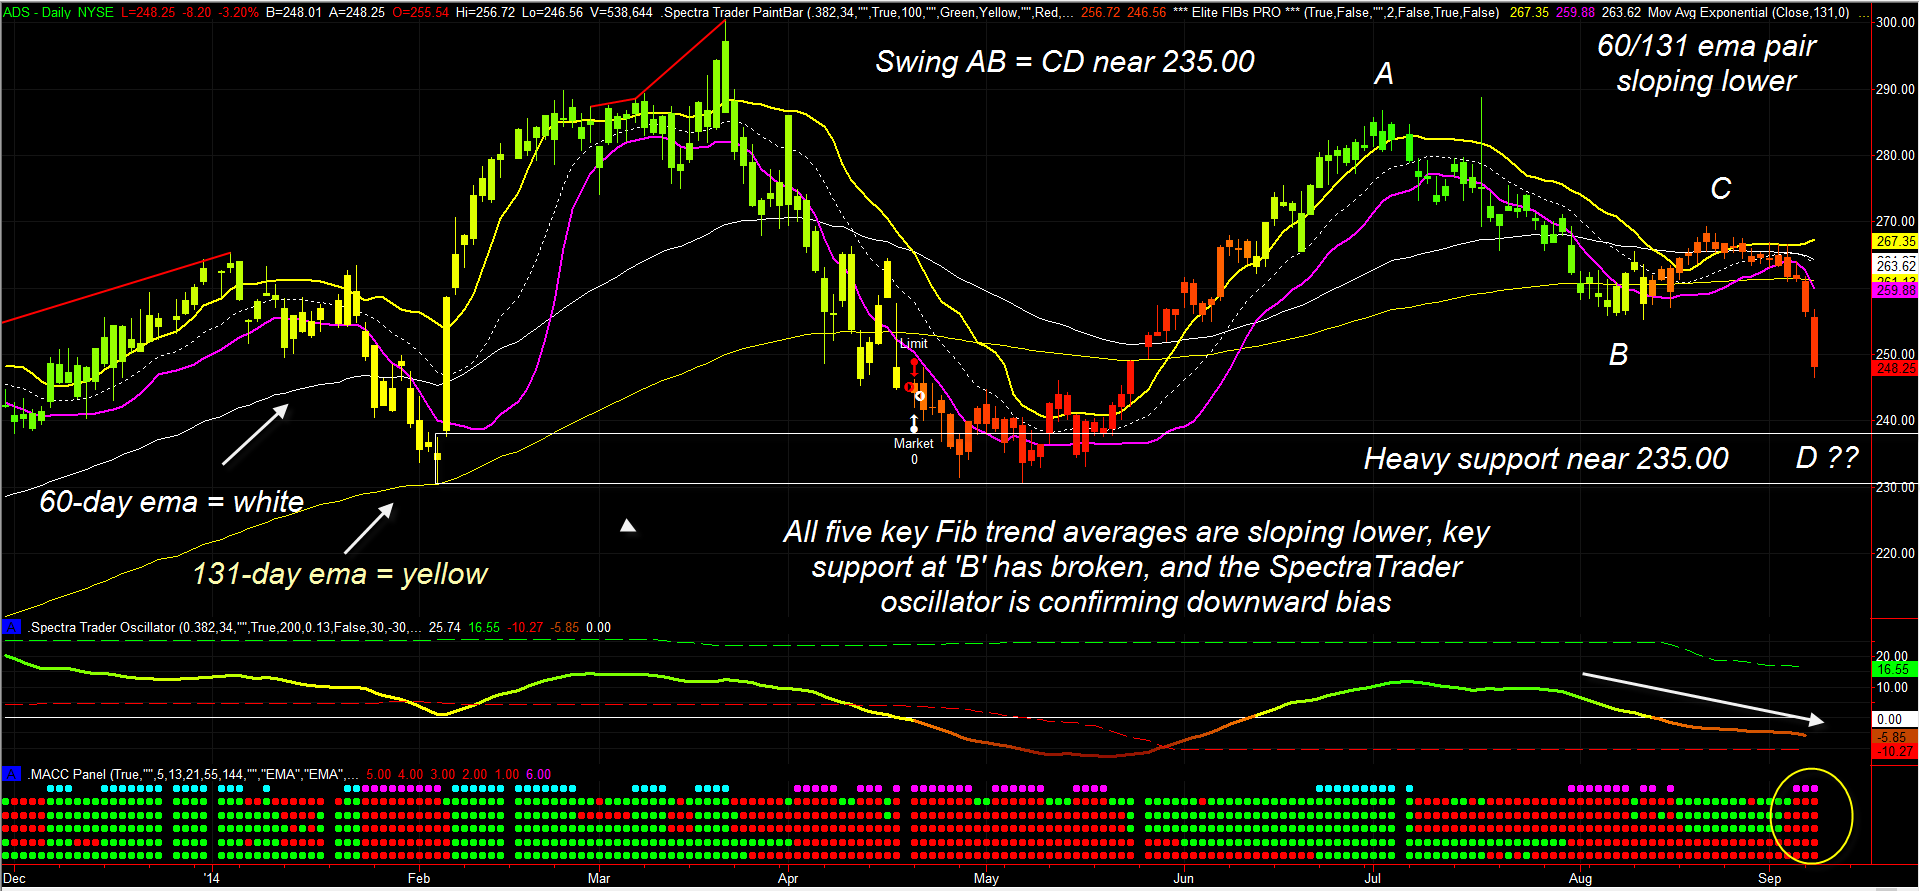
| Alliance Data Systems (ADS) is a great swing trading stock, one that is now in a high probability short swing that should be good for another 5% decline over the next week or two before major support is reached. Here's a closer look at ADS now, using its daily chart (Figure 1). |
|
| Figure 1. Alliance Data Systems (ADS) is currently mid-way through a beautiful AB = CD short swing trade pattern; next major support resides near 235.00. |
| Graphic provided by: TradeStation. |
| Graphic provided by: Elite Trader Indicators by Fibozachi.com. |
| |
| One of the keys to successful swing trading is to trade only those stocks that exhibit regular, smooth price cycles that can be exploited for consistent gains; no matter how good your trading system is, if a stock doesn't display this sort of price action, it will be tough to net consistent profits from it. Once you have a reliable "swinger" then you can apply your favorite indicator templates and trading systems and making money will be easier, assuming you employ strict position sizing and trade management protocols. ADS is a great example of a reliable swinger, and here are some of the technical tools used to identify its current short trade setup: 1. The Elite Fibs Pro bands act as entry/exit triggers once a stock closes above/below them for two consecutive bars. Breakouts from narrow range bands (just three days ago) carry more potential for a powerful swing move, all else being equal. 2. The SpectraTrader oscillator acts as a longer-term trend filter; the strongest trends occur after zero line crosses and the color is either orange (bearish) or green (bullish). The slope of the oscillator also confirms trend direction and whether or not a divergence is beginning to manifest. 3. The moving average panel at the bottom of the chart highlights periods when the 5-, 13- 21-, 55- and 144-day averages are all sloping lower (pink dots) or higher (cyan dots), alerting traders to potential swing/trend trading moves in progress. 4. Simple AB=CD Fibonacci swing analysis can also be used to predict a target price for swing CD; in this case swing CD equals AB near 235.00, which also happens to coincide with a heavy area of previous support. 5. Since the breakout from the narrow band range, daily range has greatly expanded, with ADS dropping sharply. 6. ADS is ranked with a bearish fundamental score, based on its recent earnings growth trend. |
|
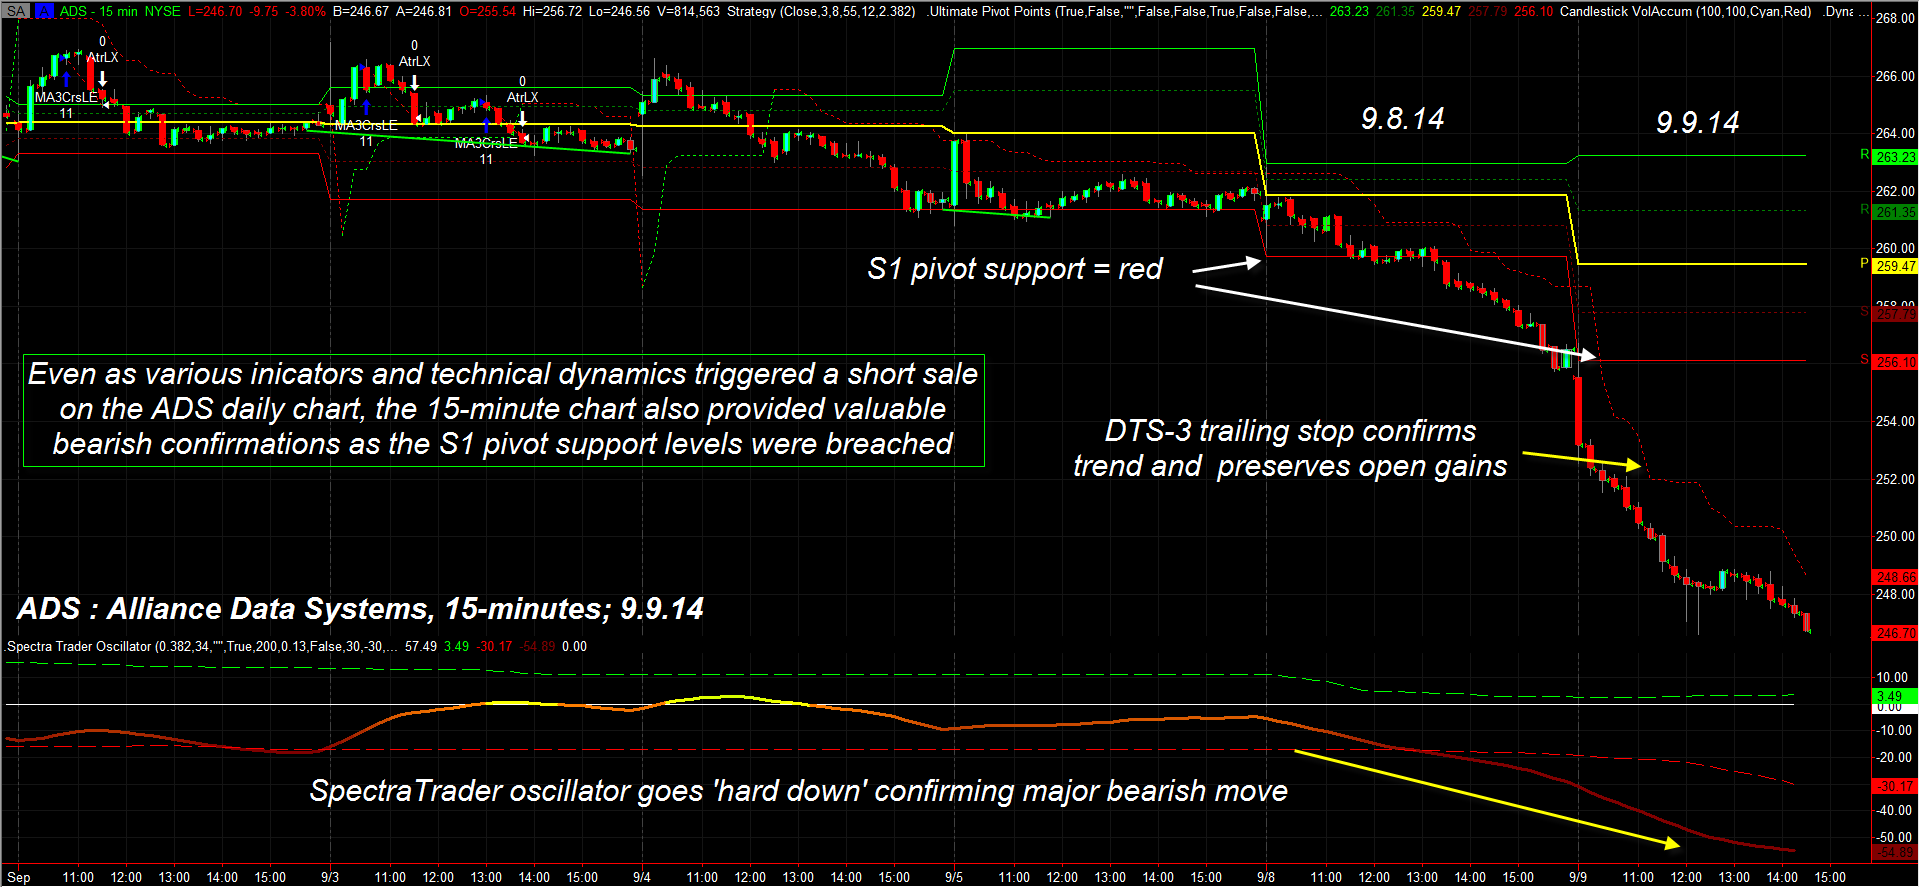
| Figure 2. Once ADS finally closed below, and stayed below, the red S1 pivot support line on its 15-minute chart, the stock went into a bearish free fall. |
| Graphic provided by: TradeStation. |
| Graphic provided by: Elite Trader Indicators by Fibozachi.com. |
| |
| All told, that's a recipe for a nice short swing trade, and that's what played out, starting several trading sessions ago. What's even nicer is that an enterprising trader can use intraday charts, momentum and pivot points to help fine tune short entries with much less risk, as I will show you here: Applied to the 15-minute chart in Figure 2 is a special "3-point" support/resistance pivot, where closes below the red S1 line indicate bearish (bullish) trend continuation (and vice versa for breaks above the green R1 pivot), especially when you already have major, higher time frame confirmation of bearish momentum. Once ADS closed below — and stayed below — the red S1 line, all that was left to do was manage the bearish trend with a trailing stop. So far, ADS has dropped sharply, and most traders would be okay by staying short until the red trailing stop is breached to the upside. However, there is major support near 235.00, so any further decline below 240.00 might be seen as a great opportunity to begin scaling out even before the stop is hit. It's also possible that ADS could temporarily stop out, stage a minor bounce, and then the same kind of daily/intraday bearish synergy will take hold again. Momentum trading isn't always easy, but using a variety of complimentary technicals and analysis techniques can make the pathway to profitability much easier. Trade wisely until we meet here again. |
Freelance financial markets writer and online publisher of the Trendzetterz.com S&P 500 Weekly Forecast service.
| Title: | Market consultant and writer |
| Company: | Trendzetterz |
| Address: | 81 Hickory Hollow Drive |
| Crossville, TN 38555 | |
| Phone # for sales: | 904-303-4814 |
| Website: | trendzetterz.com |
| E-mail address: | support@trendzetterz.com |
Traders' Resource Links | |
| Trendzetterz has not added any product or service information to TRADERS' RESOURCE. | |
Click here for more information about our publications!
PRINT THIS ARTICLE

Request Information From Our Sponsors
- VectorVest, Inc.
- Executive Premier Workshop
- One-Day Options Course
- OptionsPro
- Retirement Income Workshop
- Sure-Fire Trading Systems (VectorVest, Inc.)
- Trading as a Business Workshop
- VectorVest 7 EOD
- VectorVest 7 RealTime/IntraDay
- VectorVest AutoTester
- VectorVest Educational Services
- VectorVest OnLine
- VectorVest Options Analyzer
- VectorVest ProGraphics v6.0
- VectorVest ProTrader 7
- VectorVest RealTime Derby Tool
- VectorVest Simulator
- VectorVest Variator
- VectorVest Watchdog
- StockCharts.com, Inc.
- Candle Patterns
- Candlestick Charting Explained
- Intermarket Technical Analysis
- John Murphy on Chart Analysis
- John Murphy's Chart Pattern Recognition
- John Murphy's Market Message
- MurphyExplainsMarketAnalysis-Intermarket Analysis
- MurphyExplainsMarketAnalysis-Visual Analysis
- StockCharts.com
- Technical Analysis of the Financial Markets
- The Visual Investor