HOT TOPICS LIST
- MACD
- Fibonacci
- RSI
- Gann
- ADXR
- Stochastics
- Volume
- Triangles
- Futures
- Cycles
- Volatility
- ZIGZAG
- MESA
- Retracement
- Aroon
INDICATORS LIST
LIST OF TOPICS
PRINT THIS ARTICLE
by Billy Williams
Bilgari Holdings, Inc. (BH) just experienced a price gap so large that it's stock could sink.
Position: Sell
Billy Williams
Billy Williams has been trading the markets for 27 years, specializing in momentum trading with stocks and options.
PRINT THIS ARTICLE
SHORT SELLING
Bilgari Changing Course
09/15/14 04:43:52 PMby Billy Williams
Bilgari Holdings, Inc. (BH) just experienced a price gap so large that it's stock could sink.
Position: Sell
| The markets may be favoring bulls but it pays to stay alert for shorting opportunities. At the first sign of market weakness they fall harder and faster than other stocks, especially high-priced stocks vulnerable to the bears. If things turn bearish they have further to fall and the profits are ripe for the picking. I have come across one stock that has begun to trade lower with a lot of downside potential to hedge your current portfolio. Before breaking down the analysis for this short candidate, it's important to understand how to use part of your capital for short-selling. Other than profit potential, committing part of your capital to shorts helps minimize risk by having shorts to offset your long positions. Here's one stock that looks to have changed hands from bulls to bears and may end up falling quite a bit. |

|
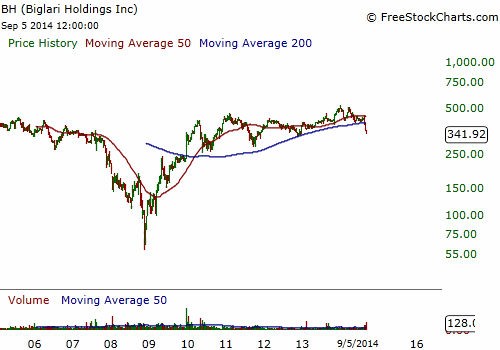
| Figure 1. Bilgari Holdings (BH) has fought its way back from the 2008 housing crisis but has been stuck in a period of price contraction for years. |
| Graphic provided by: www.freestockcharts.com. |
| |
| Biglari Holdings Inc. (BH) is engaged in the operation and franchising of restaurants in the United States. It has ownership, operation, and franchising of restaurants under restaurant concepts Steak n Shake, Western Sizzlin, Great American Steak & Buffet, and Wood Grill Buffet. BH got hit in the 2008 housing crisis and traded down off a price high of $434 to as low as $63.80 in December of that same year. By the time 2009 rolled around, BH found its legs and began marching higher, making a steady series of higher highs and higher lows. This showed that the bulls had taken control of the stock's price movement and were in it for the long haul over the next few years as BH repaired the technical damage caused by the housing crisis. |

|
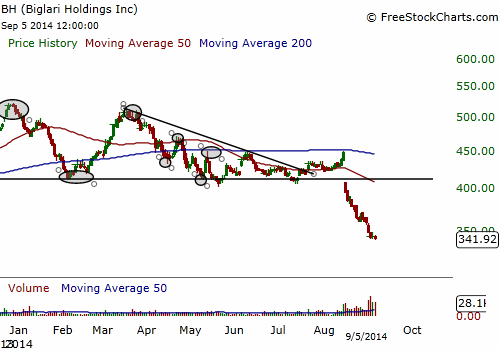
| Figure 2. After peaking at $523, the stock has made a steady series of lower highs but found support at the $410 level. The 50-day simple moving average crossed below the 200-day simple moving average signaling a change in the trend followed by a massive price gap that confirmed the bears were now in full control of the stock's price action. |
| Graphic provided by: www.freestockcharts.com. |
| |
| In 2010, BH peaked and then entered a period of price contraction (Figure 1). Price flirted with the $446 price point but could never muster the strength to break free of it. This went on up till 2013 when BH traded above that price point and on up to $523 in December of that same year and then promptly rolled over. The stock price of BH has made some half-hearted attempts and a bullish rally but can't make it past whatever previous price high it forms at the time. Support has held and, as a result, a descending triangle has formed. A "death cross" also formed on May 27, 2014 when the 50-day simple moving average (SMA) traded below the 200-day SMA, signaling a transfer of power away from the bulls and into the hands of the bears. On August 14, 2014, BH made another rally attempt that quickly reversed the following day on the tail of a massive bearish price gap. This was the confirmation that the bears were now firmly in control and BH's price action has traded down ever since (Figure 2). |
| With the bearish move underway, you would be wise to sit back, wait for a bounce, and then enter short either with stocks or using put options. After experiencing such weak price action, you can expect BH to experince more technical damage and trend lower. Wait for a pullback and then enter as price resumes the downward trend. Use a 7% stop loss if you short the stock and take profits on half your position and trail the rest. Similarly, with put options just adjust the overall risk based on the premium of the puts you buy and likewise on the profit taking. |
Billy Williams has been trading the markets for 27 years, specializing in momentum trading with stocks and options.
| Company: | StockOptionSystem.com |
| E-mail address: | stockoptionsystem.com@gmail.com |
Traders' Resource Links | |
| StockOptionSystem.com has not added any product or service information to TRADERS' RESOURCE. | |
Click here for more information about our publications!
PRINT THIS ARTICLE

Request Information From Our Sponsors
- StockCharts.com, Inc.
- Candle Patterns
- Candlestick Charting Explained
- Intermarket Technical Analysis
- John Murphy on Chart Analysis
- John Murphy's Chart Pattern Recognition
- John Murphy's Market Message
- MurphyExplainsMarketAnalysis-Intermarket Analysis
- MurphyExplainsMarketAnalysis-Visual Analysis
- StockCharts.com
- Technical Analysis of the Financial Markets
- The Visual Investor
- VectorVest, Inc.
- Executive Premier Workshop
- One-Day Options Course
- OptionsPro
- Retirement Income Workshop
- Sure-Fire Trading Systems (VectorVest, Inc.)
- Trading as a Business Workshop
- VectorVest 7 EOD
- VectorVest 7 RealTime/IntraDay
- VectorVest AutoTester
- VectorVest Educational Services
- VectorVest OnLine
- VectorVest Options Analyzer
- VectorVest ProGraphics v6.0
- VectorVest ProTrader 7
- VectorVest RealTime Derby Tool
- VectorVest Simulator
- VectorVest Variator
- VectorVest Watchdog
