HOT TOPICS LIST
- MACD
- Fibonacci
- RSI
- Gann
- ADXR
- Stochastics
- Volume
- Triangles
- Futures
- Cycles
- Volatility
- ZIGZAG
- MESA
- Retracement
- Aroon
INDICATORS LIST
LIST OF TOPICS
PRINT THIS ARTICLE
by Thomas Bopp
The GBPUSD currency pair has been in a strong downtrend since mid-July. Lately, an important line was broken. Is this a signal for more short-selling?
Position: Hold
Thomas Bopp
Thomas Bopp has more than 25 years experience in all kinds of trading. He mainly trades options on the short-side based on his own unique trading systems. He is also responsible for a German and Spanish free daily market newsletter, which covers the S&P 500, Ibex 35, DAX and German Bund-Future.
PRINT THIS ARTICLE
OPTIONS ANALYSIS
Can The GBP/USD Currency Pair Go Much Lower?
09/12/14 05:16:46 PMby Thomas Bopp
The GBPUSD currency pair has been in a strong downtrend since mid-July. Lately, an important line was broken. Is this a signal for more short-selling?
Position: Hold
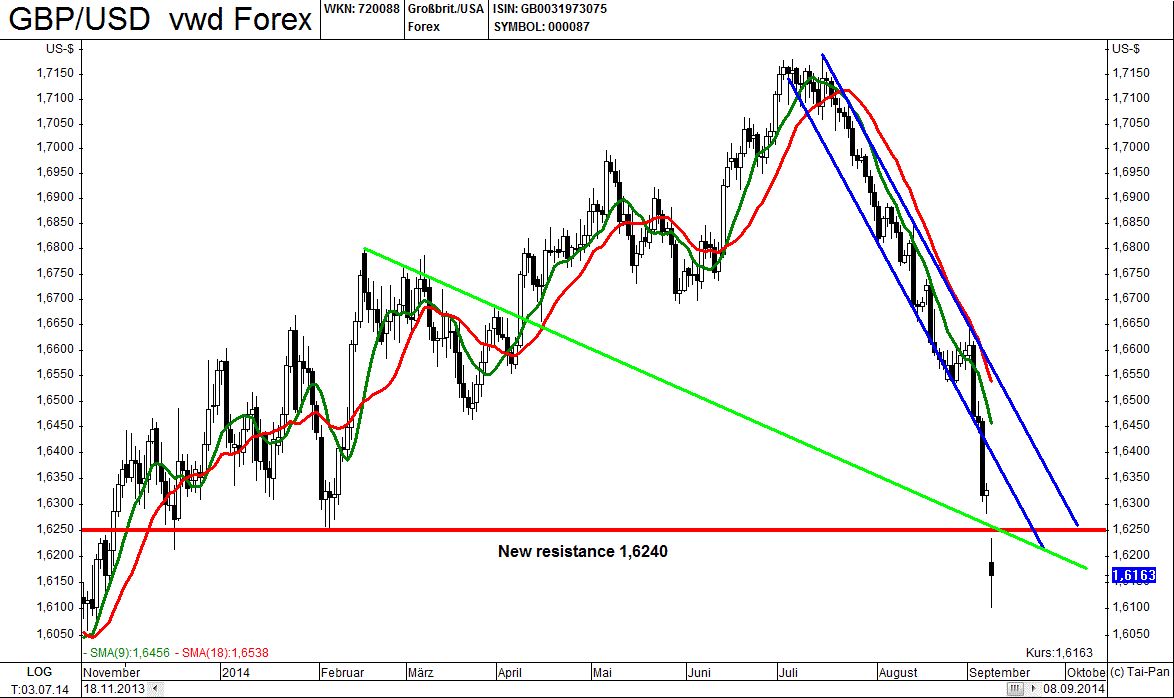
| On September 8, 2014, an important double support at 1.6240 was broken with a gap in the GBPUSD. A technical analyst would say that this suggests the likelihood of further losses. On a daily timeframe, this support turns into a resistance level. |

|
| The daily chart o GBPUSD shows a support broken, now serves at a new resistance. For most technical analysts this is a major sell-signal. |
| Graphic provided by: www.lp-software.de. |
| |
| Most technical analysts will point to further losses under 1.60. Figure 1 displays the candle chart with important lines. The next big support is at 1.585. Will it really go there or is the worst over? |

|
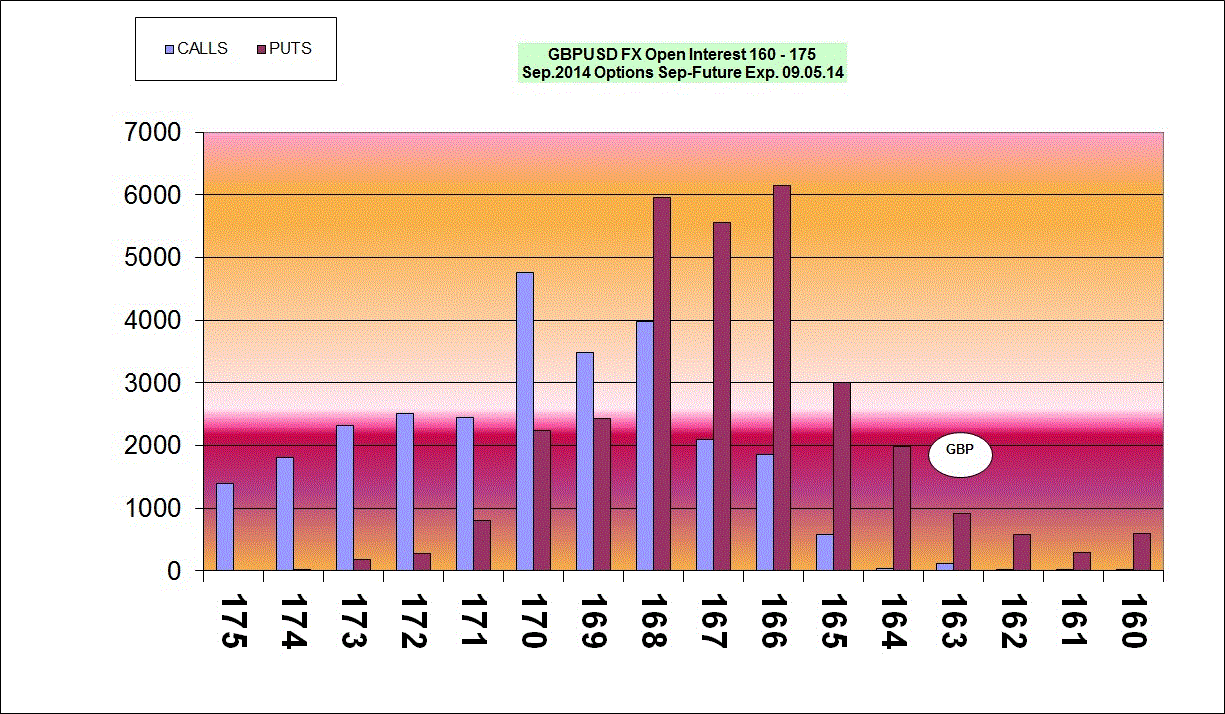
| The open-interest-chart of the expired september-options on curency-future, traded on the the CME tells us, that most put-options ran in the money, therefore had to be hedged by selling GBPUSD-futures short |
| Graphic provided by: Authorīs own chart. |
| |
| Why was this move so tough in the last few days? You may think that the European Central Bank and the Federal Reserve Bank may be the reasons but if you look at Figure 2, you'll see why the strong movement occurred. September 5, 2014 was an options expiry date for currency futures traded at the Chicago Mercantile Exchange. For option sellers the worst time is when a big move starts close to an expiration day. The chart in Figure 3 shows the open interest of the expired options. A put option with a basis lower than 1.66 turns in-the-money. This generates fear among option sellers. The strong move to the downside was supported by strong hedging. |

|
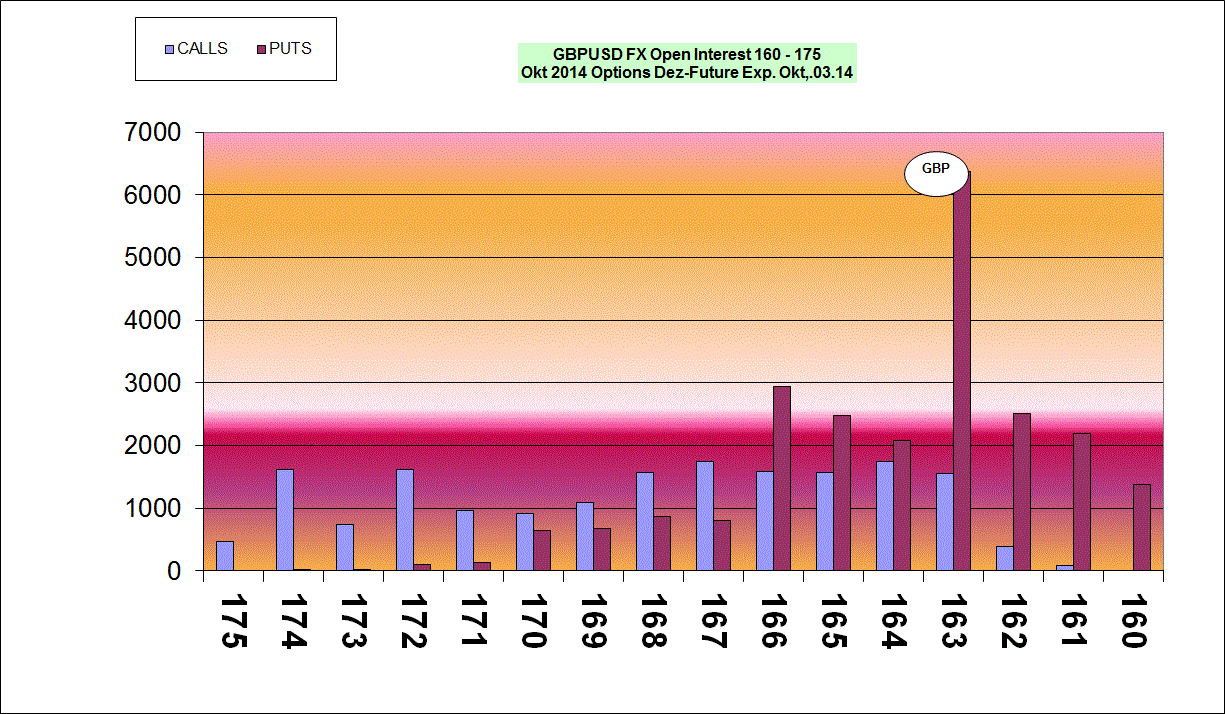
| The new front-month had the highest put-OI at exercise-price 1,63. These options ran today in the money, bringing more pain to the optionsellers. |
| Graphic provided by: Authosīs own chart. |
| |
| Let us now take a look at the new open interest figures for contracts expiring the first Friday after the first Wednesday in October. The put option bar at the exercise price of 1.63 is more than three times as high as that of the other exercise prices. Put options of 1.63 were still secure and out-of-the-money on Friday evening. Usually option sellers don't act as long as the basis holds and the move below 1.63 must be at least 30 ticks, before future selling sets in. If so, based on my findings, it will provide another thrust in the downward direction. At the beginning of this new week, option sellers were caught on the wrong foot. The British pound against the US dollar opened under 1.62. As far as I can see, this artificial supported move is over and further weakness in the currency pair has a low probability. |

|
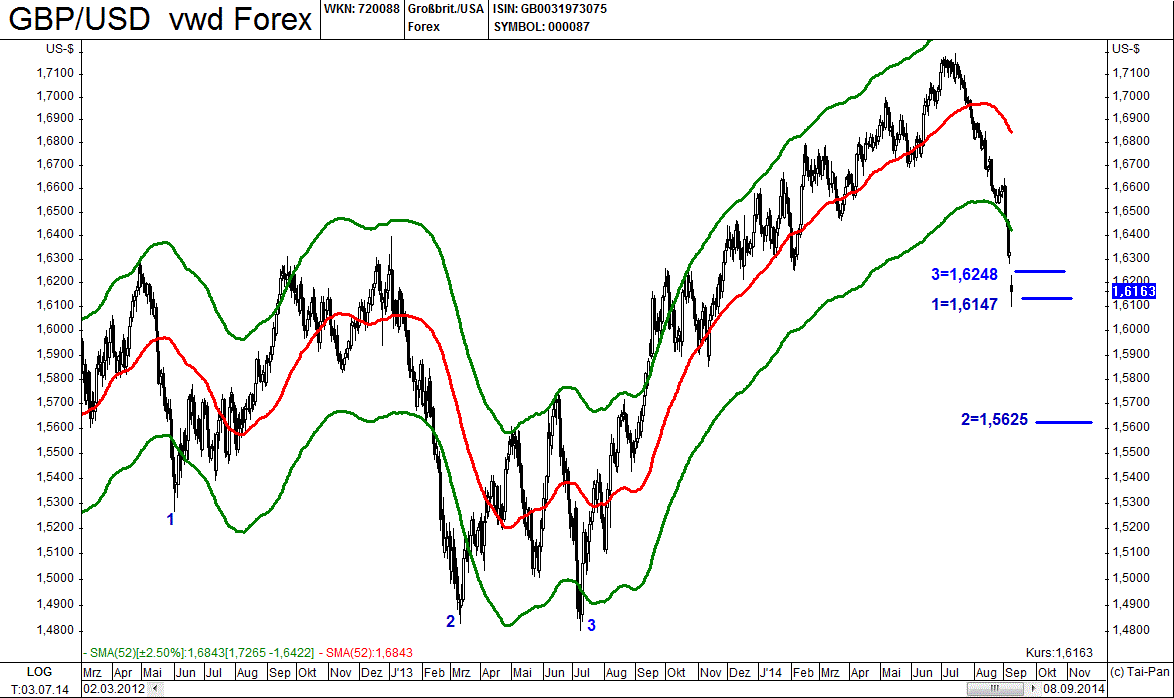
| Envelopes can be used at targets. If upper or lower band are exceeded, one can use the move as target for actual moves. As seen, two of the three targets are now reached. |
| Graphic provided by: www.lp-software.de. |
| |
| In Figure 4 you see a daily envelope chart. The ribbons are calculated on the basis of a simple 52-day moving average and have a deviation of 2.5%. The lower or upper envelope shows, if reached, a top or bottom is coming. In the last three days, this lower envelope was broken and it seems, that the bottom-formation is in doubt. Another way to apply this envelope is to find targets. If either the lower or upper band is broken, the length of that move can be used to make a forecast for a high probability area, where the future move could end. Three such situations are marked. If GBPUSD comes in just like point 1, a target emerges at 1.6147. If point 2 serves as a target, the British pound can fall further to 1.5668. The third situation points to a target of 1.6248. Two out of three possible target-areas are already reached. The likelihood of a short-term bottom is high, so traders should narrow their stops. Although 1.5668 is not impossible, the envelope chart shows that there is a low probability that a short position will make money. |
Thomas Bopp has more than 25 years experience in all kinds of trading. He mainly trades options on the short-side based on his own unique trading systems. He is also responsible for a German and Spanish free daily market newsletter, which covers the S&P 500, Ibex 35, DAX and German Bund-Future.
| Title: | Freelance trader and analyst |
| Company: | Bopp's Financial Market Studies |
| Address: | Eichendorffweg 6 |
| 61194 Niddatal, Germany, 61194 | |
| Phone # for sales: | +49 60347961 |
| E-mail address: | webmaster@zyklusanalyst.de |
Traders' Resource Links | |
| Bopp's Financial Market Studies has not added any product or service information to TRADERS' RESOURCE. | |
Click here for more information about our publications!
PRINT THIS ARTICLE

Request Information From Our Sponsors
- VectorVest, Inc.
- Executive Premier Workshop
- One-Day Options Course
- OptionsPro
- Retirement Income Workshop
- Sure-Fire Trading Systems (VectorVest, Inc.)
- Trading as a Business Workshop
- VectorVest 7 EOD
- VectorVest 7 RealTime/IntraDay
- VectorVest AutoTester
- VectorVest Educational Services
- VectorVest OnLine
- VectorVest Options Analyzer
- VectorVest ProGraphics v6.0
- VectorVest ProTrader 7
- VectorVest RealTime Derby Tool
- VectorVest Simulator
- VectorVest Variator
- VectorVest Watchdog
- StockCharts.com, Inc.
- Candle Patterns
- Candlestick Charting Explained
- Intermarket Technical Analysis
- John Murphy on Chart Analysis
- John Murphy's Chart Pattern Recognition
- John Murphy's Market Message
- MurphyExplainsMarketAnalysis-Intermarket Analysis
- MurphyExplainsMarketAnalysis-Visual Analysis
- StockCharts.com
- Technical Analysis of the Financial Markets
- The Visual Investor
