HOT TOPICS LIST
- MACD
- Fibonacci
- RSI
- Gann
- ADXR
- Stochastics
- Volume
- Triangles
- Futures
- Cycles
- Volatility
- ZIGZAG
- MESA
- Retracement
- Aroon
INDICATORS LIST
LIST OF TOPICS
PRINT THIS ARTICLE
by Thomas Bopp
Even though the S&P 500 reached a new historic high, there are stocks that show weakness. When that happens you can try this option selling strategy.
Position: Sell
Thomas Bopp
Thomas Bopp has more than 25 years experience in all kinds of trading. He mainly trades options on the short-side based on his own unique trading systems. He is also responsible for a German and Spanish free daily market newsletter, which covers the S&P 500, Ibex 35, DAX and German Bund-Future.
PRINT THIS ARTICLE
OPTIONS TRADING
A Weak Stock Among The Strong
09/11/14 04:20:34 PMby Thomas Bopp
Even though the S&P 500 reached a new historic high, there are stocks that show weakness. When that happens you can try this option selling strategy.
Position: Sell
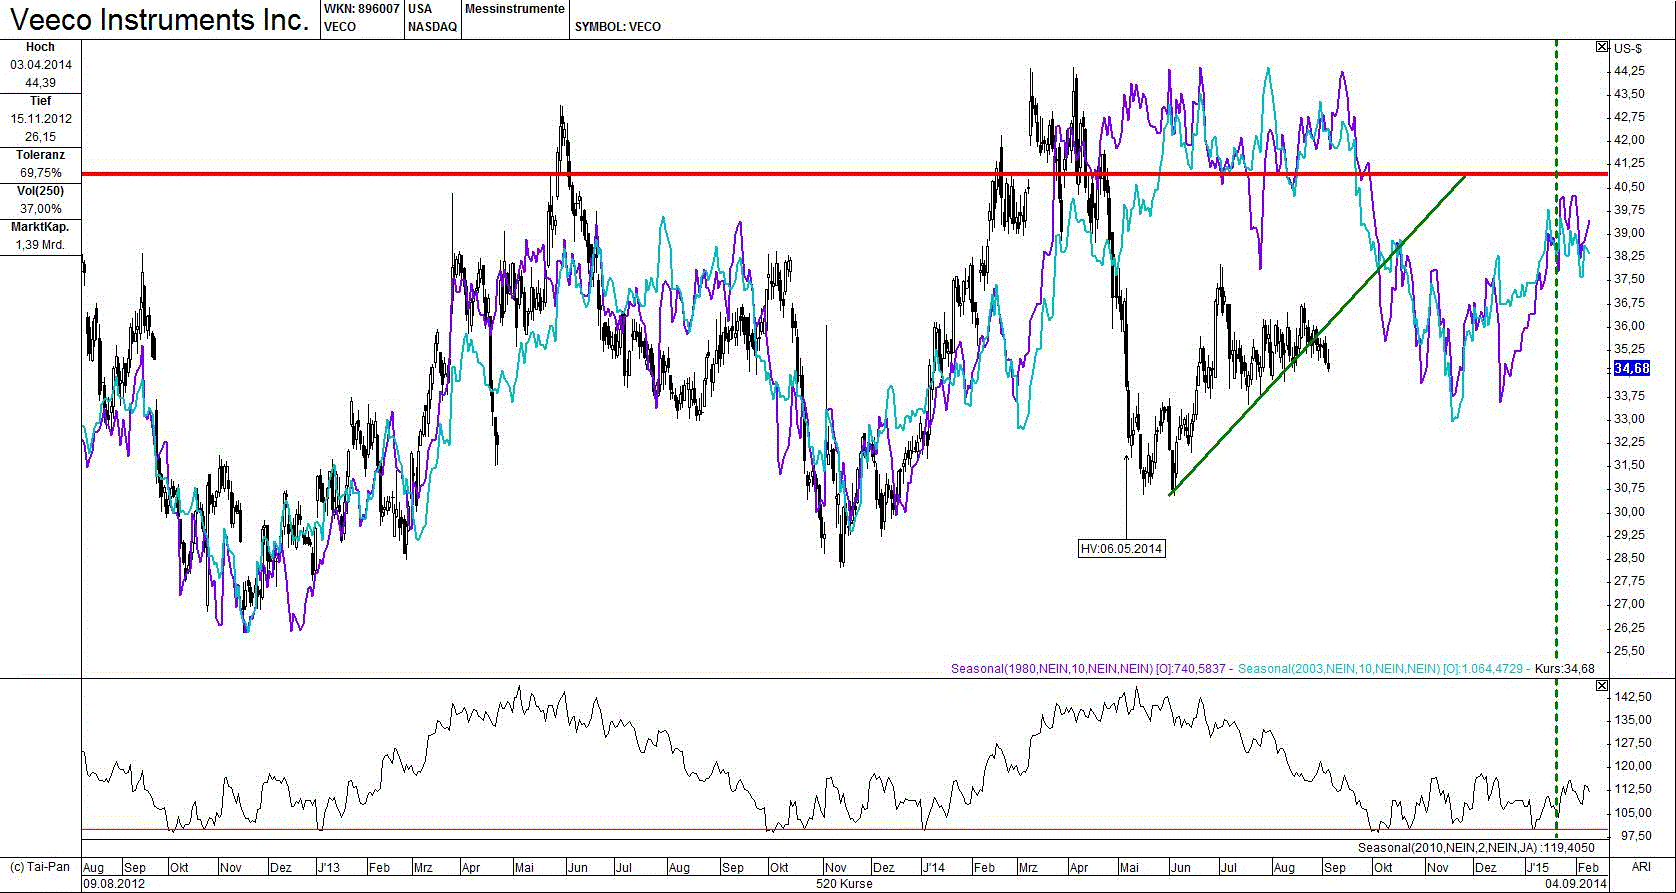
| In May 2014, Veeco instruments Inc. (VECO) failed to break out to a new two year high. When it failed the second time, it went through a 45% loss, followed by a countertrend move that started slightly above $30. This move seems to have completed when it broke its short-term uptrend. When I see this happen, I usually short an out-of-the-money call. |

|
| Figure 1. Veeco Instruments Inc. (VECO) gave a sell signal when it broke its uptrend. The seasonal lines you see on the chart support the selling of a call option. |
| Graphic provided by: www.lp-software.de. |
| |
| The chart in Figure 1 is a short-term chart with seasonal lines. Two of them are overlaid on the price chart and one is in the indicator window. The turquoise seasonal line is calculated using data from the past 10 years. The purple seasonal line is calculated using data from 1980. The indicator window is calculated using data from the last three years. The colored seasonal lines point to a top in the next few days, followed by stronger losses until November 2014. Since overall market breath is bullish, a short-signal of this type usually has little downside potential. In such a situation you could short calls. The 41 calls with a premium of $100 and an expiry on the third Friday in January 2015 are the best choice. The red horizontal line shows the option basis, while the dotted green vertical line on the right side of the charts tell us when the options will stop trading. The advantage of such a strategy would be that money is earned even when a stock is moving sideways. |

|
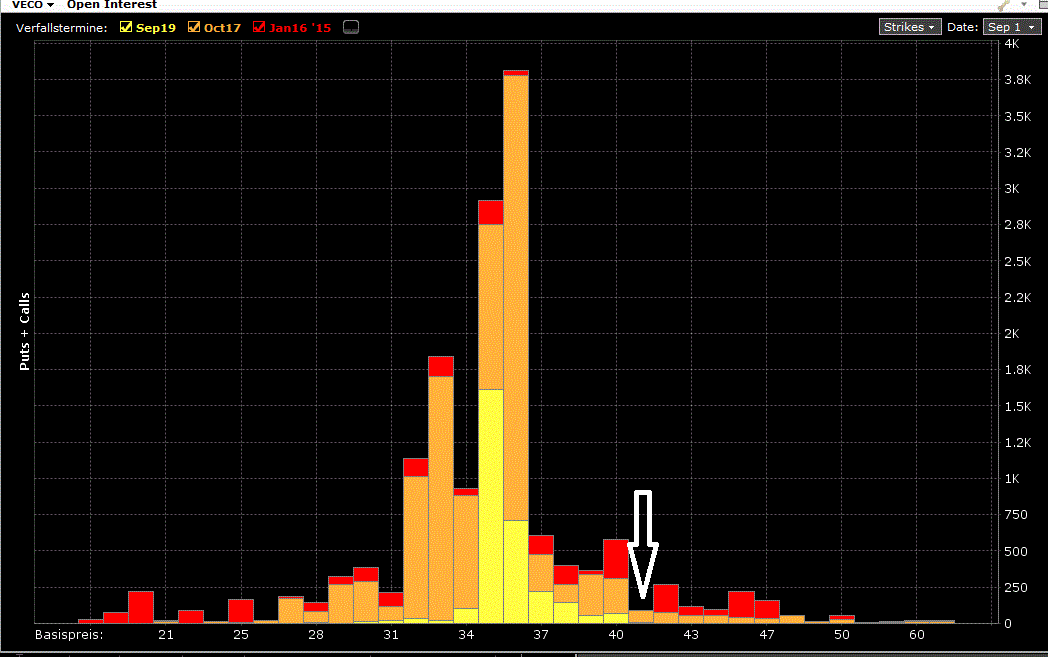
| Figure 2. Option open interest can serve as a support & resistance indicator. While the stock is trading under $35, there is strong resistance above the price. The arrow shows the basis of the written call. |
| Graphic provided by: Interactive-Broker. |
| |
| I selected the 41 calls because the open interest shows that a significantly large number of options were written above the current price of $35-36. In my research over the years, I have found that these positions serve as resistance. Figure 2 shows the open interest of all available expiration dates of the particular stock. The higher the bars, the bigger the resistance. The arrow shows the basis of the written call at 41. If this option runs into the money, the stock must first move more than 20 percent to the upside. |

|
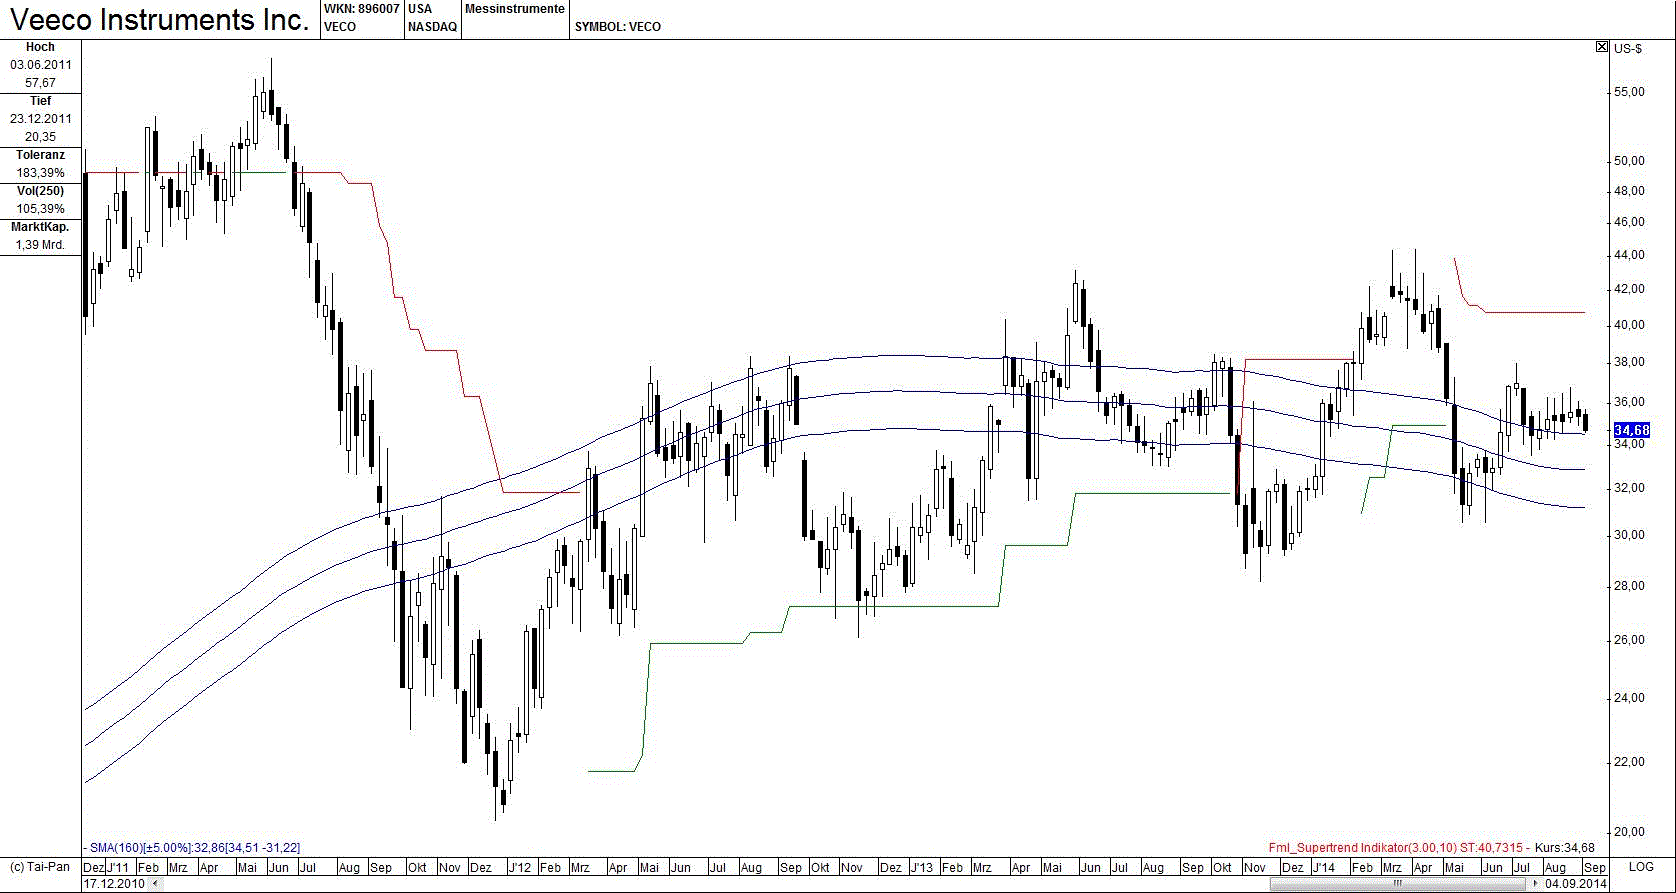
| Figure 3. The 800-day-moving-average with envelopes represent strong areas of support. The stock does not have enough downward potential and could easily trade back within the bands. |
| Graphic provided by: www.lp-software.de. |
| |
| In the weekly chart in Figure 3 you see another reason I sell calls instead of shorting the stock. The blue envelopes are calculated on the basis of 800 days, based on 160 weeks in the weekly timeframe. The envelopes are 5% wide. My research using envelopes shows that bands with this length serve as support & resistance. Normally, an outbreak through the upper band is a strong buy signal. Since the stock failed several times, it is likely that price could reverse move back into the ribbons. The downward potential therefore is restricted to the lower envelope at $31.22. A short call position requires an initial margin of $320 for each option sold. If the call becomes worthless at the end of the 4 1/2 months holding period, you can expect a yield of 30% for each option. This is far better than 9%. I would place my stop at $40.73. The green super-trend indicator is a stop & reverse system calculated by using three standard deviations based on the last 14 days. This is 20% above the current price level and is a comfortable stop level. If the call could be bought back for less than $10 in the next two months, I will close the position. |
Thomas Bopp has more than 25 years experience in all kinds of trading. He mainly trades options on the short-side based on his own unique trading systems. He is also responsible for a German and Spanish free daily market newsletter, which covers the S&P 500, Ibex 35, DAX and German Bund-Future.
| Title: | Freelance trader and analyst |
| Company: | Bopp's Financial Market Studies |
| Address: | Eichendorffweg 6 |
| 61194 Niddatal, Germany, 61194 | |
| Phone # for sales: | +49 60347961 |
| E-mail address: | webmaster@zyklusanalyst.de |
Traders' Resource Links | |
| Bopp's Financial Market Studies has not added any product or service information to TRADERS' RESOURCE. | |
Click here for more information about our publications!
Comments

|

Request Information From Our Sponsors
- StockCharts.com, Inc.
- Candle Patterns
- Candlestick Charting Explained
- Intermarket Technical Analysis
- John Murphy on Chart Analysis
- John Murphy's Chart Pattern Recognition
- John Murphy's Market Message
- MurphyExplainsMarketAnalysis-Intermarket Analysis
- MurphyExplainsMarketAnalysis-Visual Analysis
- StockCharts.com
- Technical Analysis of the Financial Markets
- The Visual Investor
- VectorVest, Inc.
- Executive Premier Workshop
- One-Day Options Course
- OptionsPro
- Retirement Income Workshop
- Sure-Fire Trading Systems (VectorVest, Inc.)
- Trading as a Business Workshop
- VectorVest 7 EOD
- VectorVest 7 RealTime/IntraDay
- VectorVest AutoTester
- VectorVest Educational Services
- VectorVest OnLine
- VectorVest Options Analyzer
- VectorVest ProGraphics v6.0
- VectorVest ProTrader 7
- VectorVest RealTime Derby Tool
- VectorVest Simulator
- VectorVest Variator
- VectorVest Watchdog
