HOT TOPICS LIST
- MACD
- Fibonacci
- RSI
- Gann
- ADXR
- Stochastics
- Volume
- Triangles
- Futures
- Cycles
- Volatility
- ZIGZAG
- MESA
- Retracement
- Aroon
INDICATORS LIST
LIST OF TOPICS
PRINT THIS ARTICLE
by Koos van der Merwe
The talk is that credit cards as we know them will move to the cellphone.
Position: Accumulate
Koos van der Merwe
Has been a technical analyst since 1969, and has worked as a futures and options trader with First Financial Futures in Johannesburg, South Africa.
PRINT THIS ARTICLE
ELLIOTT WAVE
A Look At Mastercard and Visa
09/10/14 03:27:33 PMby Koos van der Merwe
The talk is that credit cards as we know them will move to the cellphone.
Position: Accumulate
| Credit cards in Canada have changed in that today a card has a 'pin' installed. This allows a buyer to touch the machine with the card or type in a pin number, rather than swipe the card and sign a piece of paper, (how many check the card to verify the authenticity of the signature) as is still the custom in many parts of the USA. How secure is this? Not very, because if you lose your card, the finder can use it to touch the machine and complete a purchase without any verification. Now the talk is that credit cards are going to move to the cell phone and hopefully become more secure. Are Mastercard (MA) and Visa (V) going to be the leaders in this technology? Has Canada become the testing ground? The way their share prices are moving, something new is likely in the wind. |

|
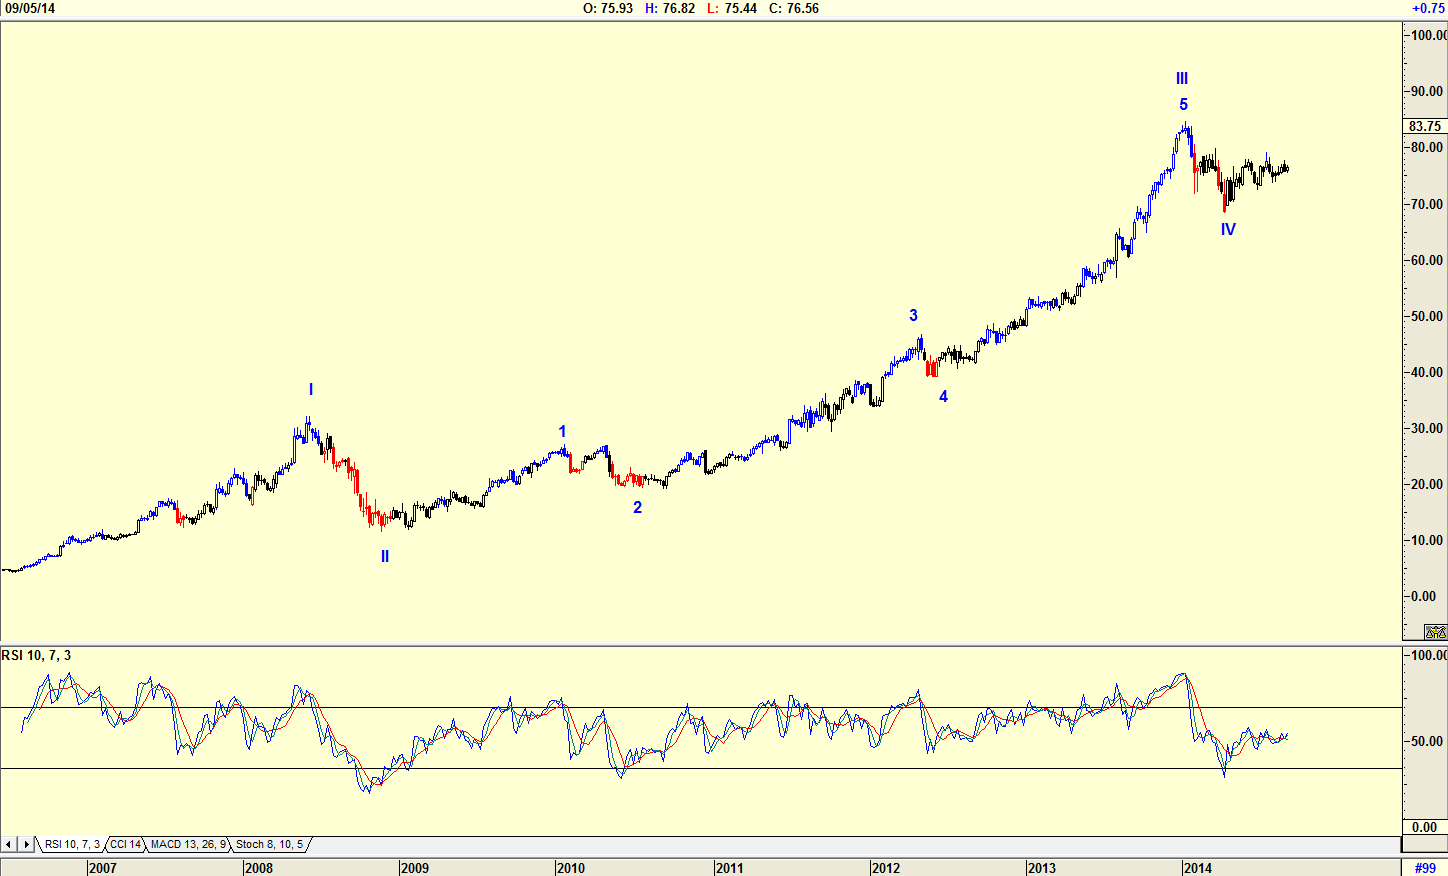
| Figure 1. Weekly chart of Mastercard with Elliott Wave count. |
| Graphic provided by: AdvancedGET. |
| |
| The chart in Figure 1 is a weekly chart of MA with an Elliott Wave count suggesting that a WAVE IV has been completed and the share price is moving sideways in preparation for a WAVE V rise which should be above $85, the high of wave 5 of WAVE III. Note the RSI indicator which is suggesting the share price should rise. |

|
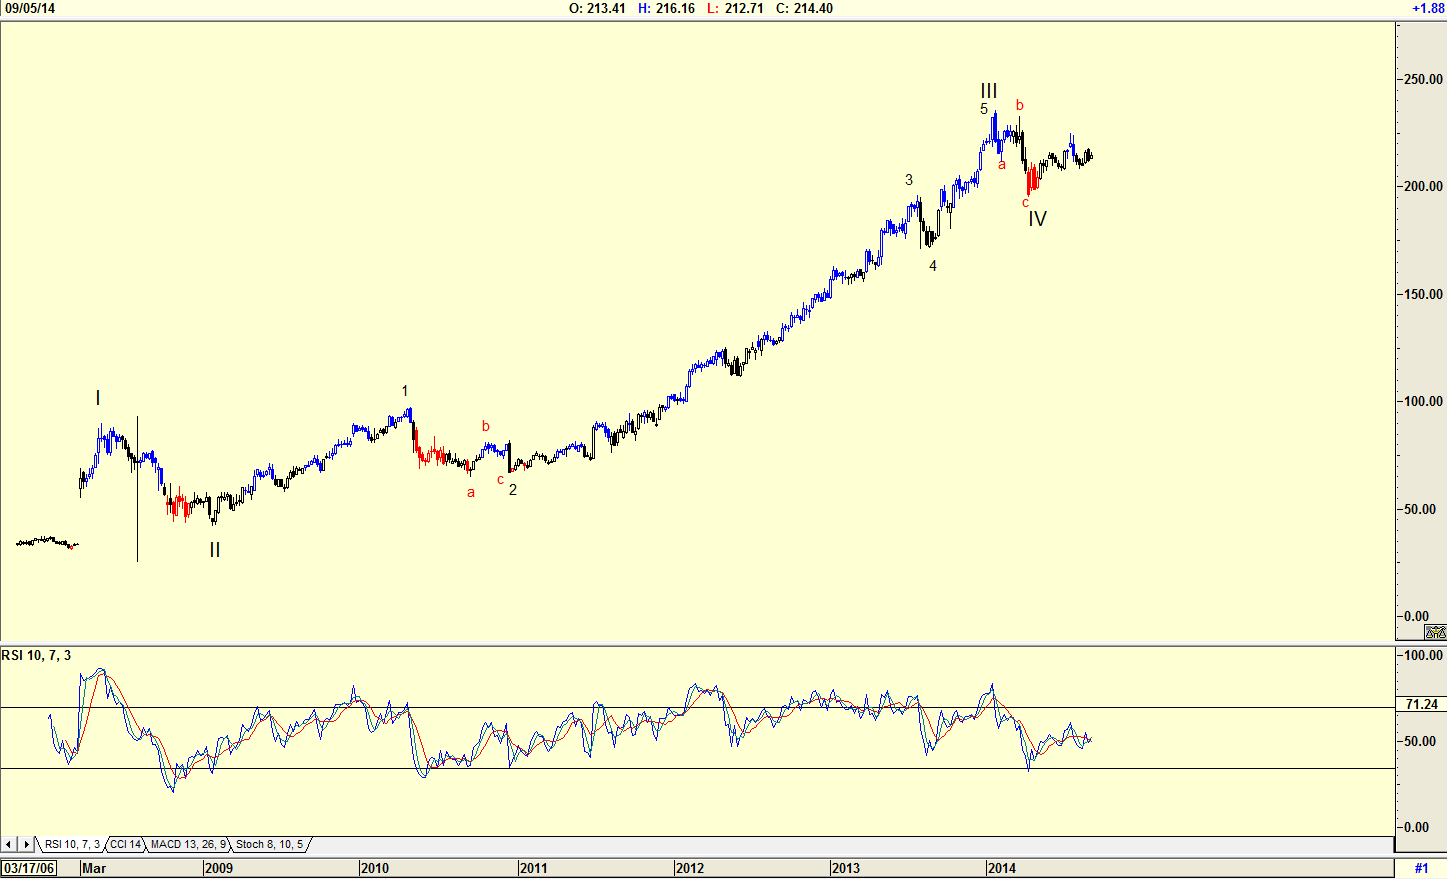
| Figure 2. Weekly chart of Visa with Elliott Wave count. |
| Graphic provided by: AdvancedGET. |
| |
| The chart in Figure 2 is a weekly chart of V with a market pattern that is identical to the MA pattern in Figure 1. The share price has also completed a WAVE IV and is moving into a WAVE V that will take it above the high of WAVE III at $236.26. The RSI indicator is also moving up suggesting that the share price should rise. |

|
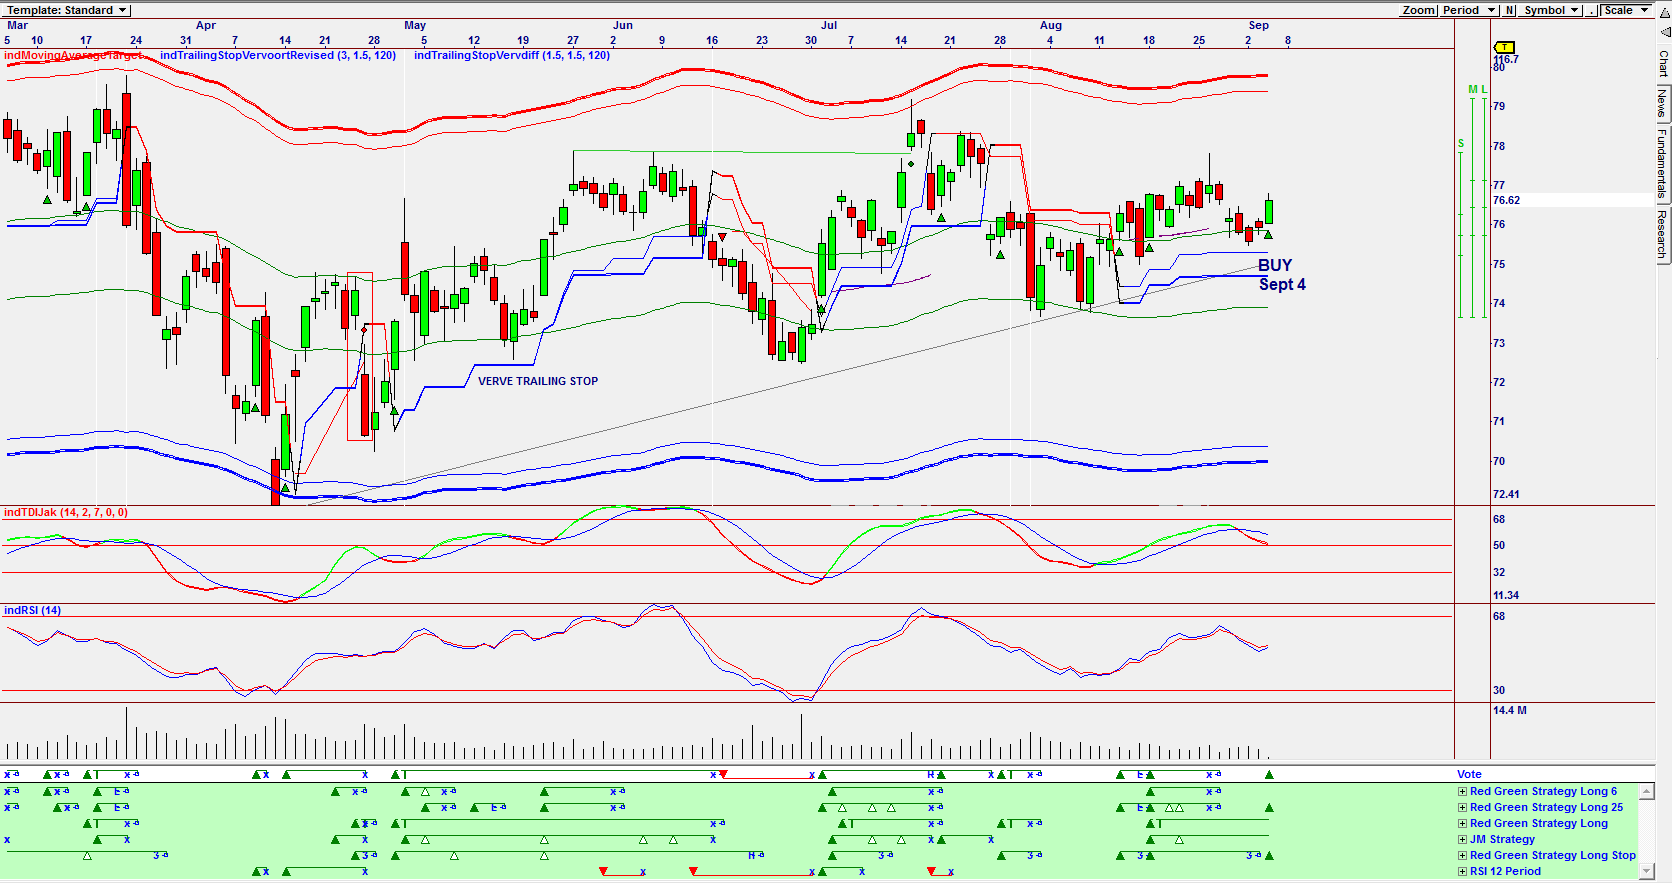
| Figure 3. Daily Omnitrader chart showing a Vote line buy signal. |
| Graphic provided by: Omnitrader. |
| |
| The chart in Figure 3 is an Omnitrader chart of Mastercard showing a buy signal given on September 4th when the price was at $76.62 based on the Red Green Strategy long 25 and the Red Green Strategy Long stop. The Red Green Strategy long 25 is a strategy built on the current price rising above the high of 25 days ago. The RedGreen Long stop strategy is built on the current price rising above the high of six days ago with the Verve trailing stop as a stop loss. Note that the Red Green Strategy Long and the JM Strategy are both in buy mode. The indRSI14 indicator has given a buy as the indicator shown in black rises above the five period moving average shown in red. The indTDIJak indicator is however still showing weakness. |

|
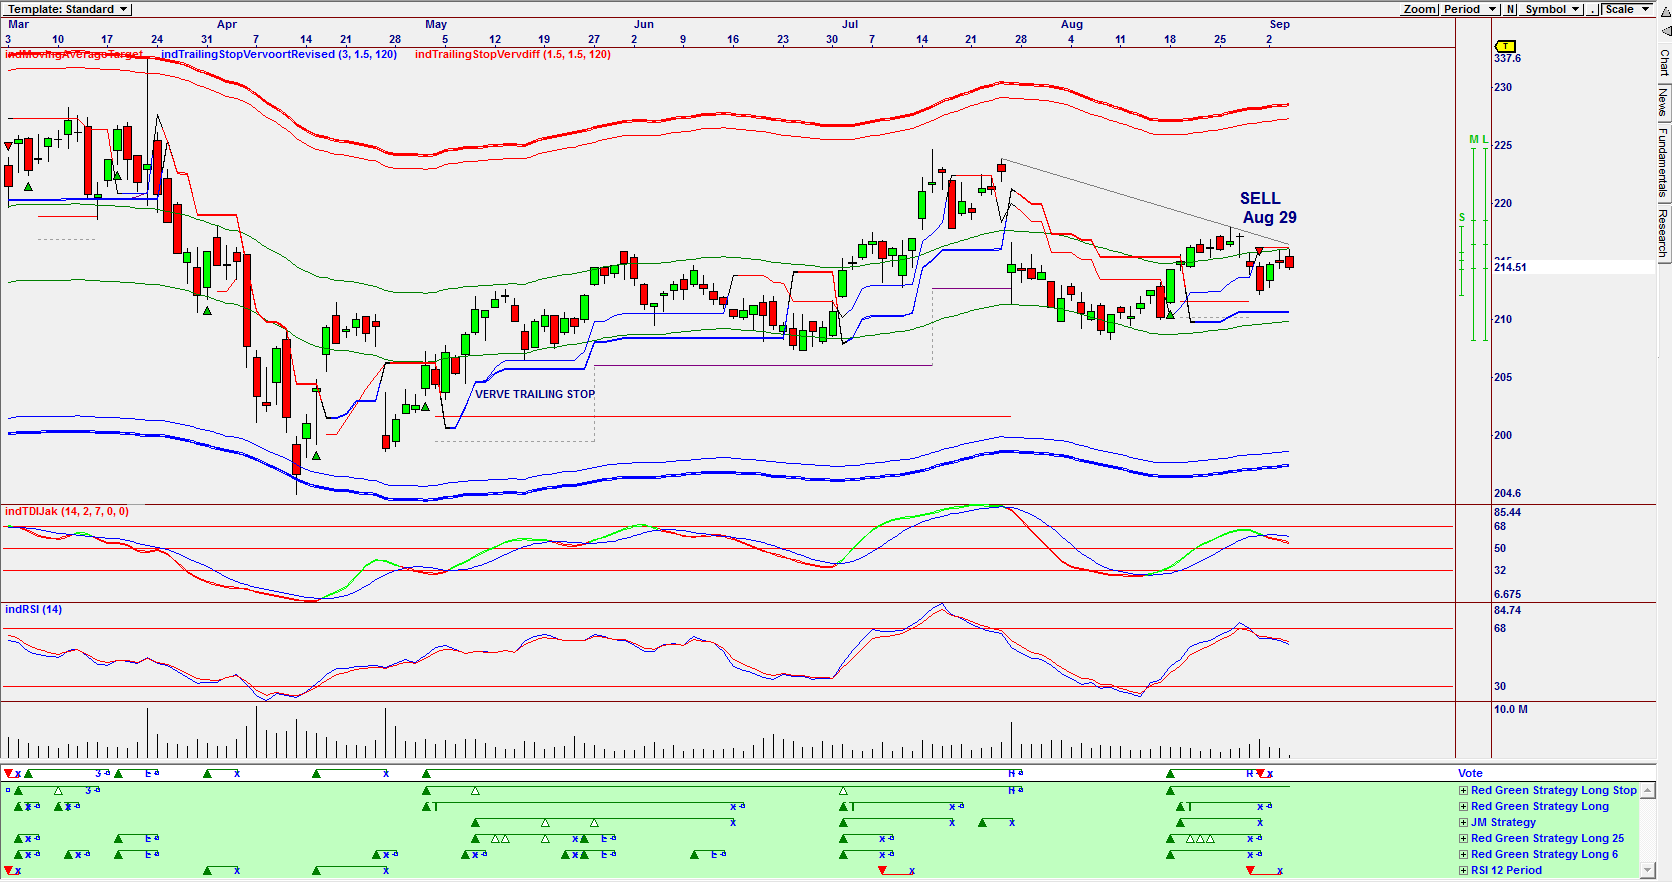
| Figure 4. Daily Omnitrader chart showing a stop signal. |
| Graphic provided by: Omnitrader. |
| |
| The chart in Figure 4 is an Omnitrader chart of V. The chart does not show a buy signal. It shows that a stop signal was hit on a short sell given on August 29, 2014. The indRSI14 indicator has not suggested a buy signal. Also note that the only strategy that is positive is the red green strategy Long stop, but the strategy was not strong enough to influence the Vote line. Are MA and V stock prices being influenced by possible innovation, or are they reflecting the future performance of the economy in the USA? With airports encouraging you to download a boarding pass to a cellphone, with Starbucks allowing you to pay for purchases via a cellphone, are MA and V experimenting with various ways to pay a purchase? Whatever they decide to do, the charts are definitely suggesting a buy for a medium- to long-term hold. |
Has been a technical analyst since 1969, and has worked as a futures and options trader with First Financial Futures in Johannesburg, South Africa.
| Address: | 3256 West 24th Ave |
| Vancouver, BC | |
| Phone # for sales: | 6042634214 |
| E-mail address: | petroosp@gmail.com |
Click here for more information about our publications!
PRINT THIS ARTICLE

Request Information From Our Sponsors
- VectorVest, Inc.
- Executive Premier Workshop
- One-Day Options Course
- OptionsPro
- Retirement Income Workshop
- Sure-Fire Trading Systems (VectorVest, Inc.)
- Trading as a Business Workshop
- VectorVest 7 EOD
- VectorVest 7 RealTime/IntraDay
- VectorVest AutoTester
- VectorVest Educational Services
- VectorVest OnLine
- VectorVest Options Analyzer
- VectorVest ProGraphics v6.0
- VectorVest ProTrader 7
- VectorVest RealTime Derby Tool
- VectorVest Simulator
- VectorVest Variator
- VectorVest Watchdog
- StockCharts.com, Inc.
- Candle Patterns
- Candlestick Charting Explained
- Intermarket Technical Analysis
- John Murphy on Chart Analysis
- John Murphy's Chart Pattern Recognition
- John Murphy's Market Message
- MurphyExplainsMarketAnalysis-Intermarket Analysis
- MurphyExplainsMarketAnalysis-Visual Analysis
- StockCharts.com
- Technical Analysis of the Financial Markets
- The Visual Investor
