

HOT TOPICS LIST
- MACD
- Fibonacci
- RSI
- Gann
- ADXR
- Stochastics
- Volume
- Triangles
- Futures
- Cycles
- Volatility
- ZIGZAG
- MESA
- Retracement
- Aroon
INDICATORS LIST
LIST OF TOPICS
PRINT THIS ARTICLE
by Donald W. Pendergast, Jr.
Shares of DH Horton are setting up for a near-term short play.
Position: N/A
Donald W. Pendergast, Jr.
Freelance financial markets writer and online publisher of the Trendzetterz.com S&P 500 Weekly Forecast service.
PRINT THIS ARTICLE
SHORT SELLING
DHI: Short Setup Forming
09/10/14 03:19:31 PMby Donald W. Pendergast, Jr.
Shares of DH Horton are setting up for a near-term short play.
Position: N/A
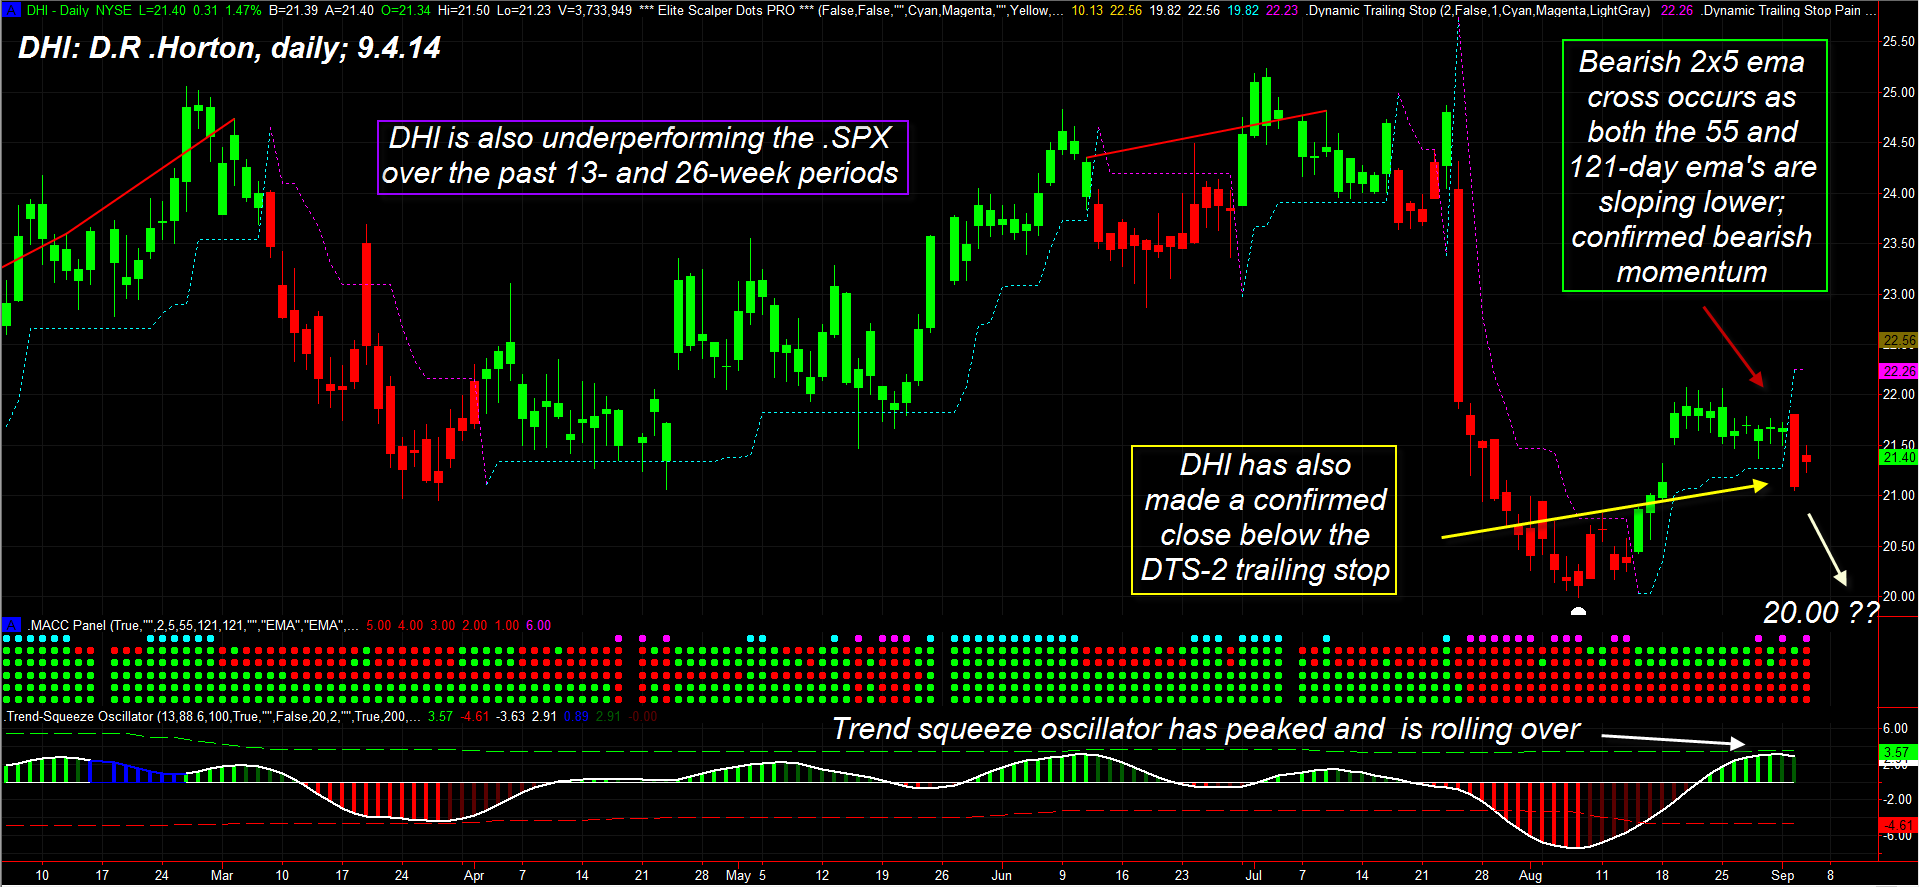
| Shorting stocks requires a unique set of trading skills, along with the ability to take reasonable profits as they manifest. Here's a look at a daily chart short setup in shares of DH Horton (DHI) along with some key short sale facts that you need to know to achieve success (Figure 1). |
|
| Figure 1. D.R. Horton (DHI) appears to be on the cusp of a high probability short trade setup. Heavy bearish momentum will face powerful support near 20.00, however, making that level a good place to cover for a profit. |
| Graphic provided by: TradeStation. |
| Graphic provided by: Elite Trader Indicators by Fibozachi.com. |
| |
| If you take the time to look at images of successful short trades in various trading education books, many times you'll see cherry-picked charts that show stocks in huge, sustained downdrafts, such as the kind we saw in 1973/1974, 2000/2002 and 2007/2009. Such extreme examples can give new traders a distorted set of expectations, leading them to attempt the art of short selling without a firm understanding of stock market dynamics — like these: 1. The long-term bias of stock prices is heavily tilted toward the bullish side of the equation, due to these factors: a. Consistently inflationary monetary policies of the Federal Reserve work to the advantage of stock buyers, particularly long-term trend followers. b. The vast majority of mutual funds have a 'long-only' provision in their charters that forbid them from shorting stocks. 2. Times when the vast majority of stocks plunge in unison are generally few and far between; these periods can produce outsized gains for short sellers, but are so infrequent as to make the habit of short selling in bullish market phases an exercise in frustration. 3. Dividend repayment risks are an extra splash of cold water on short sellers. 4. Short covering risks pose a risk to open short gains, meaning that traders need to keep a watchful eye on all short positions. 5. Short sellers also need to know exactly where key support levels are, as market pros are nimble to book short gains at such price zones; get caught short as they cover and book profits and you may witness most, if not all your open gains vanish. 6. Finally, short sellers need to be keenly aware of multiple time frame trends, focusing on taking small, manageable profits from declines in stock prices. |
|
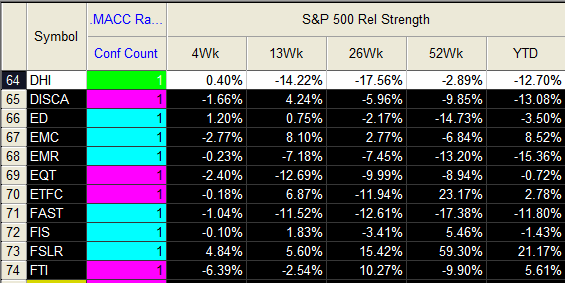
| Figure 2. DHI is underperforming the S&P 500 index in four of the five time periods shown here. |
| Graphic provided by: TradeStation. |
| Graphic provided by: TradeStation RadarScreen. |
| |
| Obviously, with so many obstacles stacked against short traders, those who can consistently turn a profit are a rare breed. But here are some valuable tips that can give you an edge over inexperienced short sellers: 1. Use a combination of very short-term and longer term moving averages to stay abreast of bearish shifts in momentum. The chart of DHI uses a 55/121-day exponential moving average (EMA) combo to determine the dominant trend and also uses a two/five-day EMA pair to trigger trade entries and exits (averages not shown to reduce clutter). When a magenta top plots atop the moving average control center (MACC) panel, bearish agreement between all four EMAs has been achieved. 2. Use a standard deviation trailing stop as another trend/momentum confirmation; DHI has just closed below the dynamic trailing stop (DTS) set at a factor of two. The candles will turn red once this happens, allowing fast visual confirmation of breakdowns (breakouts). 3. Using the trend squeeze oscillator, I find that DHI has likely completed a proportional retracement and may continue moving lower. 4. DHI is significantly underperforming the S&P 500 index (.SPX, SPY) over the past 13- and 26-week periods and is also weaker than the .SPX year-to-date. Overall, the evidence for more downside is compelling; there is a strong area or chart/previous trading volume support at 20.00 and that has to be the 'no brainer' buy-to-cover price point for this short in DHI. The entry trigger is when 21.23 is taken out; use either the DTS-2 trailing stop or a bullish cross of the two/five-daily EMA as your exit signal, unless the 20.00 profit target is hit first. The big idea here is to catch a high probability bearish surge and then ride it down to the next significant support level and then exit the trade. Forget trying to be a bear market hero with setups like this; instead, simply go for lots of base hits (or even a successful bunt) and you'll be far more profitable as a short seller than novices who expect to hit a grand slam every time. Finally, keep your account risk on short trades at 1% or less and remember to trade wisely until we meet here again. |
Freelance financial markets writer and online publisher of the Trendzetterz.com S&P 500 Weekly Forecast service.
| Title: | Market consultant and writer |
| Company: | Trendzetterz |
| Address: | 81 Hickory Hollow Drive |
| Crossville, TN 38555 | |
| Phone # for sales: | 904-303-4814 |
| Website: | trendzetterz.com |
| E-mail address: | support@trendzetterz.com |
Traders' Resource Links | |
| Trendzetterz has not added any product or service information to TRADERS' RESOURCE. | |
Click here for more information about our publications!
PRINT THIS ARTICLE

Request Information From Our Sponsors
- StockCharts.com, Inc.
- Candle Patterns
- Candlestick Charting Explained
- Intermarket Technical Analysis
- John Murphy on Chart Analysis
- John Murphy's Chart Pattern Recognition
- John Murphy's Market Message
- MurphyExplainsMarketAnalysis-Intermarket Analysis
- MurphyExplainsMarketAnalysis-Visual Analysis
- StockCharts.com
- Technical Analysis of the Financial Markets
- The Visual Investor
- VectorVest, Inc.
- Executive Premier Workshop
- One-Day Options Course
- OptionsPro
- Retirement Income Workshop
- Sure-Fire Trading Systems (VectorVest, Inc.)
- Trading as a Business Workshop
- VectorVest 7 EOD
- VectorVest 7 RealTime/IntraDay
- VectorVest AutoTester
- VectorVest Educational Services
- VectorVest OnLine
- VectorVest Options Analyzer
- VectorVest ProGraphics v6.0
- VectorVest ProTrader 7
- VectorVest RealTime Derby Tool
- VectorVest Simulator
- VectorVest Variator
- VectorVest Watchdog