HOT TOPICS LIST
- MACD
- Fibonacci
- RSI
- Gann
- ADXR
- Stochastics
- Volume
- Triangles
- Futures
- Cycles
- Volatility
- ZIGZAG
- MESA
- Retracement
- Aroon
INDICATORS LIST
LIST OF TOPICS
PRINT THIS ARTICLE
by Donald W. Pendergast, Jr.
Shares of Apple Inc. have reacted negatively to recent news, but its long-term uptrend appears to be in no immediate danger.
Position: N/A
Donald W. Pendergast, Jr.
Freelance financial markets writer and online publisher of the Trendzetterz.com S&P 500 Weekly Forecast service.
PRINT THIS ARTICLE
REVERSAL
AAPL: Bearish Reversal, Bullish Money Flows
09/08/14 01:02:23 PMby Donald W. Pendergast, Jr.
Shares of Apple Inc. have reacted negatively to recent news, but its long-term uptrend appears to be in no immediate danger.
Position: N/A
| Apple Inc's. (AAPL) ability to innovate, adapt, and reinvent itself in the midst of a chaotic, rapidly evolving economic landscape is nothing short of amazing; most other established companies that are three or more decades old simply can't compare, regardless of the metrics being examined. Not surprisingly, AAPL has been one of the wonder stocks of the latest run-up in technology shares, up as much as 47% between January 31, 2014 and September 2, 2014, which is an average monthly gain of nearly 7%. That's outstanding for a giant-cap stock, and now that it seems everyone is hip to the AAPL phenomenon, it's little surprise that the stock has stalled and has begun to correct some of 2014's healthy gains. Here's a look at this initial reversal, likely near-term support levels, and ways to play what is now unfolding in this stock. |

|
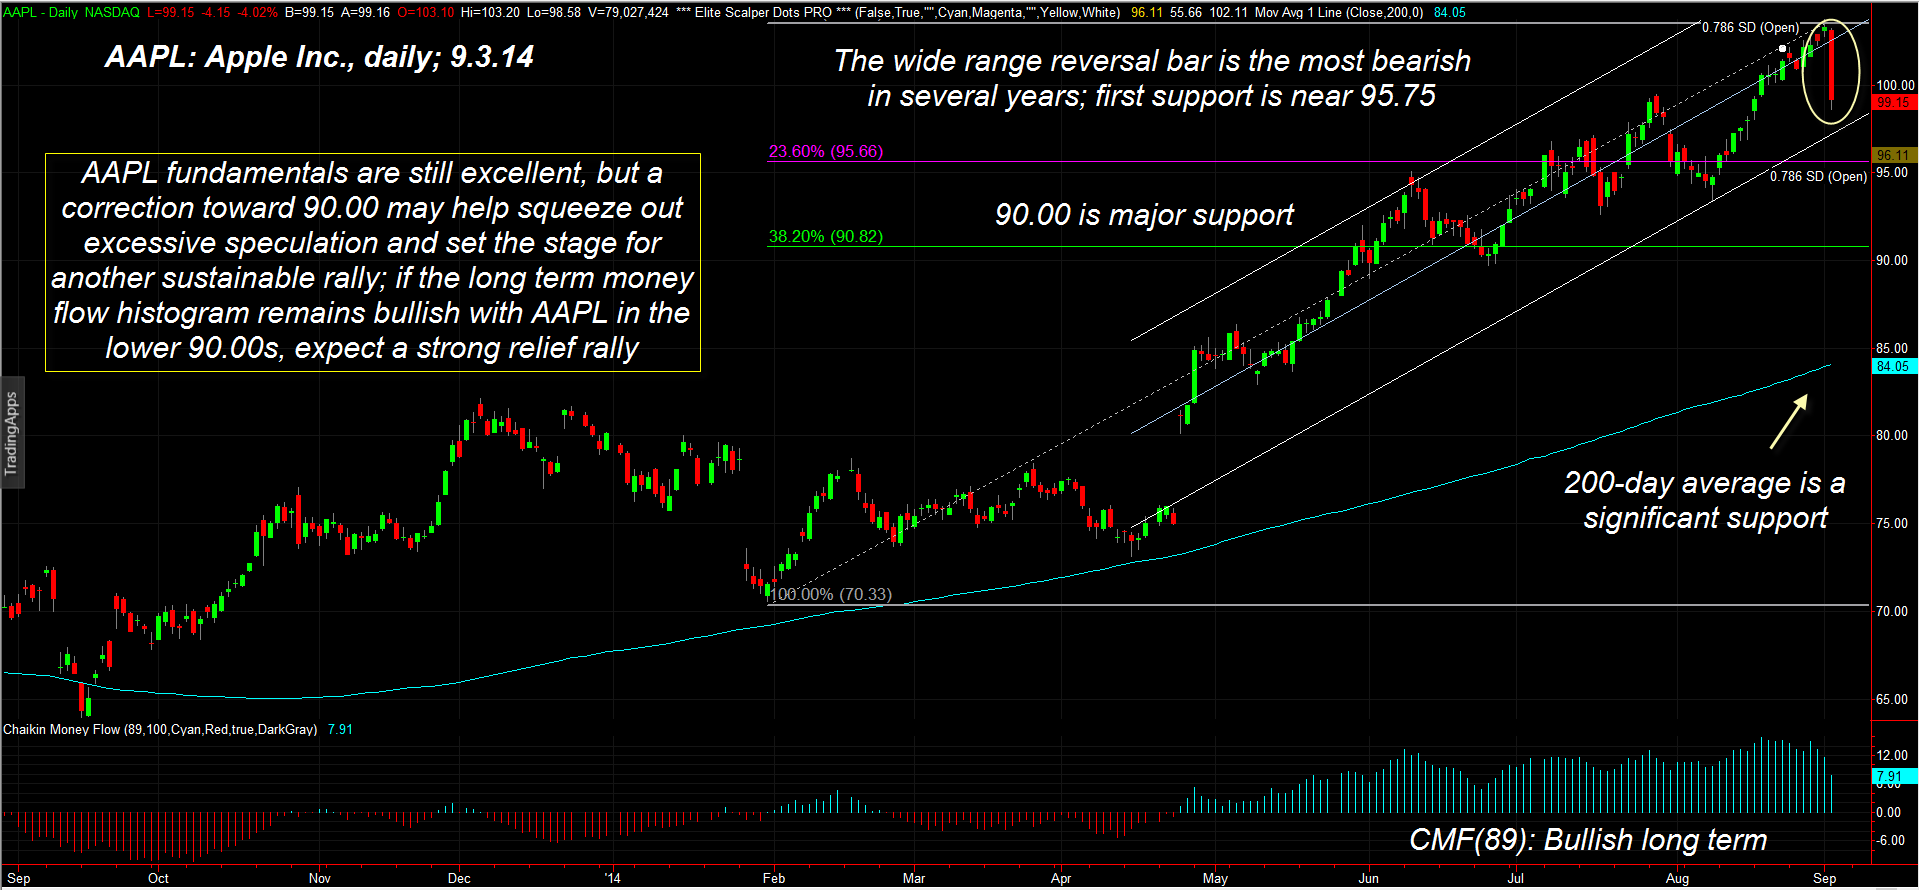
| Figure 1. The new daily bearish reversal candle is the largest in many years; however, the long term uptrend in the stock remains intact. Expect a powerful bounce should the stock descend into the 90.00/91.00 area. |
| Graphic provided by: TradeStation. |
| |
| The multicycle low that formed in late January 2014 occurred midway of a consolidation pattern that ultimately proved to be the foundation for AAPL's subsequent 47% surge into early September 2014 (see Figure 1); running a linear regression channel and a Fibonacci retracement grid between the 70.51 low and 103.74 high reveals where at least three critical support zones lie for AAPL as it begins to correct: 1. Minor support at the lower edge of the channel — currently near 97.80. 2. Fibonacci 23.6% support near 95.66. 3. Major chart/Fibonacci support near 90.82. As bad as the wide, bearish reversal bar of September 3, 2014 looks, AAPL's long-term uptrend has hardly been nicked at all: 1. The 200-day simple moving average (SMA) is still sloping higher, with AAPL trading more than $15 above it. 2. The 89-day Chaikin Money Flow (CMF)(89) is still bullish, and well above its zero line. Now, no trader/investor in their right mind should attempt to catch a falling knife; the big idea here being that existing longs in AAPL should be closed out now and that there will be a good re-entry point somewhere between 95.50 and 90.00 for patient, skilled traders. |

|
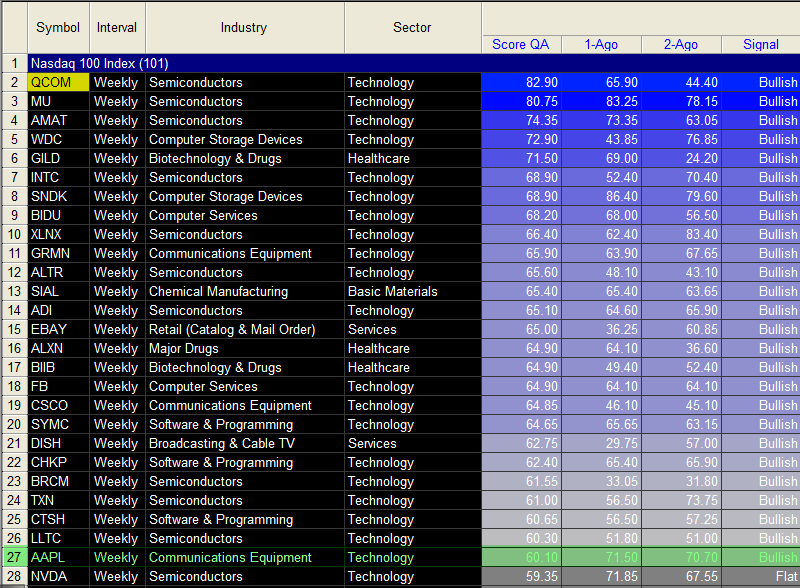
| Figure 2. AAPL still has bullish fundamentals, one of 26 Nasdaq 100 index (.NDX, QQQ) stocks with an above-average fundamental ranking. |
| Graphic provided by: TradeStation. |
| Graphic provided by: TradeStation RadarScreen. |
| |
| Speculative bears may wish to buy the December 2014 AAPL $105.00 put option; this is an in-the-money (ITM) put that has modest daily time decay ($2.50/day/contract), a delta of -.6121 and a close bid/ask spread. Open interest is heavy and daily trading volume is excellent; based on historical volatility, APPL has a projected price range of 89.03 to 109.23 by December 2014 options expiration; given the heavy downward pressure after such a big run-up, it's a pretty safe play to buy the puts now and hold them in anticipation of the 95.66 support level to be reached well before expiration 15 weeks from now. The trading plan is to sell these puts if/when 95.66 is hit and then going to cash; by no means allow the puts to decrease in value by more than 50% regardless of what your emotions tell you to do, just in case the trade doesn't pan out. Trade wisely until we meet here again. |
Freelance financial markets writer and online publisher of the Trendzetterz.com S&P 500 Weekly Forecast service.
| Title: | Market consultant and writer |
| Company: | Trendzetterz |
| Address: | 81 Hickory Hollow Drive |
| Crossville, TN 38555 | |
| Phone # for sales: | 904-303-4814 |
| Website: | trendzetterz.com |
| E-mail address: | support@trendzetterz.com |
Traders' Resource Links | |
| Trendzetterz has not added any product or service information to TRADERS' RESOURCE. | |
Click here for more information about our publications!
PRINT THIS ARTICLE

|

Request Information From Our Sponsors
- StockCharts.com, Inc.
- Candle Patterns
- Candlestick Charting Explained
- Intermarket Technical Analysis
- John Murphy on Chart Analysis
- John Murphy's Chart Pattern Recognition
- John Murphy's Market Message
- MurphyExplainsMarketAnalysis-Intermarket Analysis
- MurphyExplainsMarketAnalysis-Visual Analysis
- StockCharts.com
- Technical Analysis of the Financial Markets
- The Visual Investor
- VectorVest, Inc.
- Executive Premier Workshop
- One-Day Options Course
- OptionsPro
- Retirement Income Workshop
- Sure-Fire Trading Systems (VectorVest, Inc.)
- Trading as a Business Workshop
- VectorVest 7 EOD
- VectorVest 7 RealTime/IntraDay
- VectorVest AutoTester
- VectorVest Educational Services
- VectorVest OnLine
- VectorVest Options Analyzer
- VectorVest ProGraphics v6.0
- VectorVest ProTrader 7
- VectorVest RealTime Derby Tool
- VectorVest Simulator
- VectorVest Variator
- VectorVest Watchdog
