HOT TOPICS LIST
- MACD
- Fibonacci
- RSI
- Gann
- ADXR
- Stochastics
- Volume
- Triangles
- Futures
- Cycles
- Volatility
- ZIGZAG
- MESA
- Retracement
- Aroon
INDICATORS LIST
LIST OF TOPICS
PRINT THIS ARTICLE
by Koos van der Merwe
When the market turns bearish, either close out your portfolio or hedge it in the options or futures market. These strategies are normally for players who know what they are doing, are experienced and have been able to open an options or futures account with their broker as a sophisticated trader.
Position: Hold
Koos van der Merwe
Has been a technical analyst since 1969, and has worked as a futures and options trader with First Financial Futures in Johannesburg, South Africa.
PRINT THIS ARTICLE
SPREAD TRADING
A Simple Hedge Strategy
10/24/02 03:06:21 PMby Koos van der Merwe
When the market turns bearish, either close out your portfolio or hedge it in the options or futures market. These strategies are normally for players who know what they are doing, are experienced and have been able to open an options or futures account with their broker as a sophisticated trader.
Position: Hold
| There are many traders who are not experts in calculating hedging strategies, or brokers, who, when handling client portfolios, cannot place a client in a more risky portfolio because of their age or lack of market knowledge and experience. |
| How do you then protect your portfolio, other than going into the money market or buying bonds? Both are offering very low yields in this low interest rate climate and only the risk averse will tackle something that offers a higher yield but has a low (BBB or less) rating. |

|
| A hedge of funds? |
| Graphic provided by: AdvancedGET. |
| |
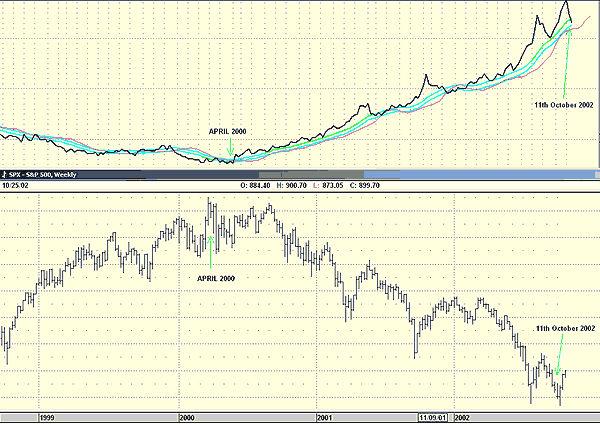
| In looking around, I found that certain mutual fund companies offer high income funds which not only pay good returns, but also have a rising NAV as the market falls. They are low risk in that the risk is to move out of them when the market starts recovering as they appear to almost mirror image the market. You can see this on the chart. |
| To explain the chart, I have added two high income funds, namely Guardian High Income Fund and Talvest Millenium High Income fund, together in a spread using the program GET. Both funds are Canadian Income Trust Funds. To determine their performance against the S&P 500 index, I then divided the S&P 500 into the sum of the two mutual funds. In other words: (Guardian High Income Funds + Talvest Millenium High Income Funds) /S&P 500. I chose the S&P 500 rather than the Toronto Stock Exchange because the latter is too heavily weighted towards resource stocks. Also, the TSX usually follows the American markets. |
| The result is the top chart. I then drew a JM internal trading band (see Traders.com Advantage article "Technical Simplicity", posted Sept. 26, 2002) to indicate buy and sell signals. As long as the chart was above the upper band and rising, I should stay in high income funds. The capital gains plus the distribution received gave them almost a 12 percent return and at low risk, far better than the 4 - 6 percent received on a low risk bond if you are lucky, or a 9 percent on a high yield but risky junk. The disadvantage is that if you were able to get a good rate on a bond you could hold it to maturity and the principle is guaranteed. With the fund strategy as outlined above, you have to monitor the market, and close out a position as the market recovers. Looking at the chart, I have shown the high yield funds on the top chart, and the S&P 500 on the bottom chart. You can see how the high income chart dipped every time the S&P 500 recovered, yet DID NOT GIVE A SELL SIGNAL. Was this an indication that the main trend was still down? Could this strategy be used to determine market direction? Why not? One is, in effect, measuring investor sentiment. Finally, I placed a stop-loss (12%) from the new high on each of the funds, so I would receive either a stop-loss sell or a JM sell should the NAV fall below the lower blue band line, whichever comes first. |
Has been a technical analyst since 1969, and has worked as a futures and options trader with First Financial Futures in Johannesburg, South Africa.
| Address: | 3256 West 24th Ave |
| Vancouver, BC | |
| Phone # for sales: | 6042634214 |
| E-mail address: | petroosp@gmail.com |
Click here for more information about our publications!
Comments
Date: 10/26/02Rank: 4Comment:

Request Information From Our Sponsors
- StockCharts.com, Inc.
- Candle Patterns
- Candlestick Charting Explained
- Intermarket Technical Analysis
- John Murphy on Chart Analysis
- John Murphy's Chart Pattern Recognition
- John Murphy's Market Message
- MurphyExplainsMarketAnalysis-Intermarket Analysis
- MurphyExplainsMarketAnalysis-Visual Analysis
- StockCharts.com
- Technical Analysis of the Financial Markets
- The Visual Investor
- VectorVest, Inc.
- Executive Premier Workshop
- One-Day Options Course
- OptionsPro
- Retirement Income Workshop
- Sure-Fire Trading Systems (VectorVest, Inc.)
- Trading as a Business Workshop
- VectorVest 7 EOD
- VectorVest 7 RealTime/IntraDay
- VectorVest AutoTester
- VectorVest Educational Services
- VectorVest OnLine
- VectorVest Options Analyzer
- VectorVest ProGraphics v6.0
- VectorVest ProTrader 7
- VectorVest RealTime Derby Tool
- VectorVest Simulator
- VectorVest Variator
- VectorVest Watchdog
