HOT TOPICS LIST
- MACD
- Fibonacci
- RSI
- Gann
- ADXR
- Stochastics
- Volume
- Triangles
- Futures
- Cycles
- Volatility
- ZIGZAG
- MESA
- Retracement
- Aroon
INDICATORS LIST
LIST OF TOPICS
PRINT THIS ARTICLE
by Koos van der Merwe
When a well known TV presenter makes a buy recommendation on a stock, do you buy that stock?
Position: Accumulate
Koos van der Merwe
Has been a technical analyst since 1969, and has worked as a futures and options trader with First Financial Futures in Johannesburg, South Africa.
PRINT THIS ARTICLE
ELLIOTT WAVE
Popeyes Louisiana Kitchen
09/08/14 12:56:11 PMby Koos van der Merwe
When a well known TV presenter makes a buy recommendation on a stock, do you buy that stock?
Position: Accumulate
| Reading the many emails sent to you suggesting stocks to buy; listening to presenters on various television business news channels telling you that a specific stock is a must buy; listening to insider information on a stock that is a must buy given to you with a whisper while playing golf with a stranger, should you go out and buy the stock, or should you first research the stock fundamentally or technically? Fundamentally, you will learn little, because the insider information given is still to be made public, but technically, you can see whether those who have insider information are buying or selling. Popeyes Louisana Kitchen (PLKI) has been tipped by a well known TV presenter as a buy What do the charts say? |

|
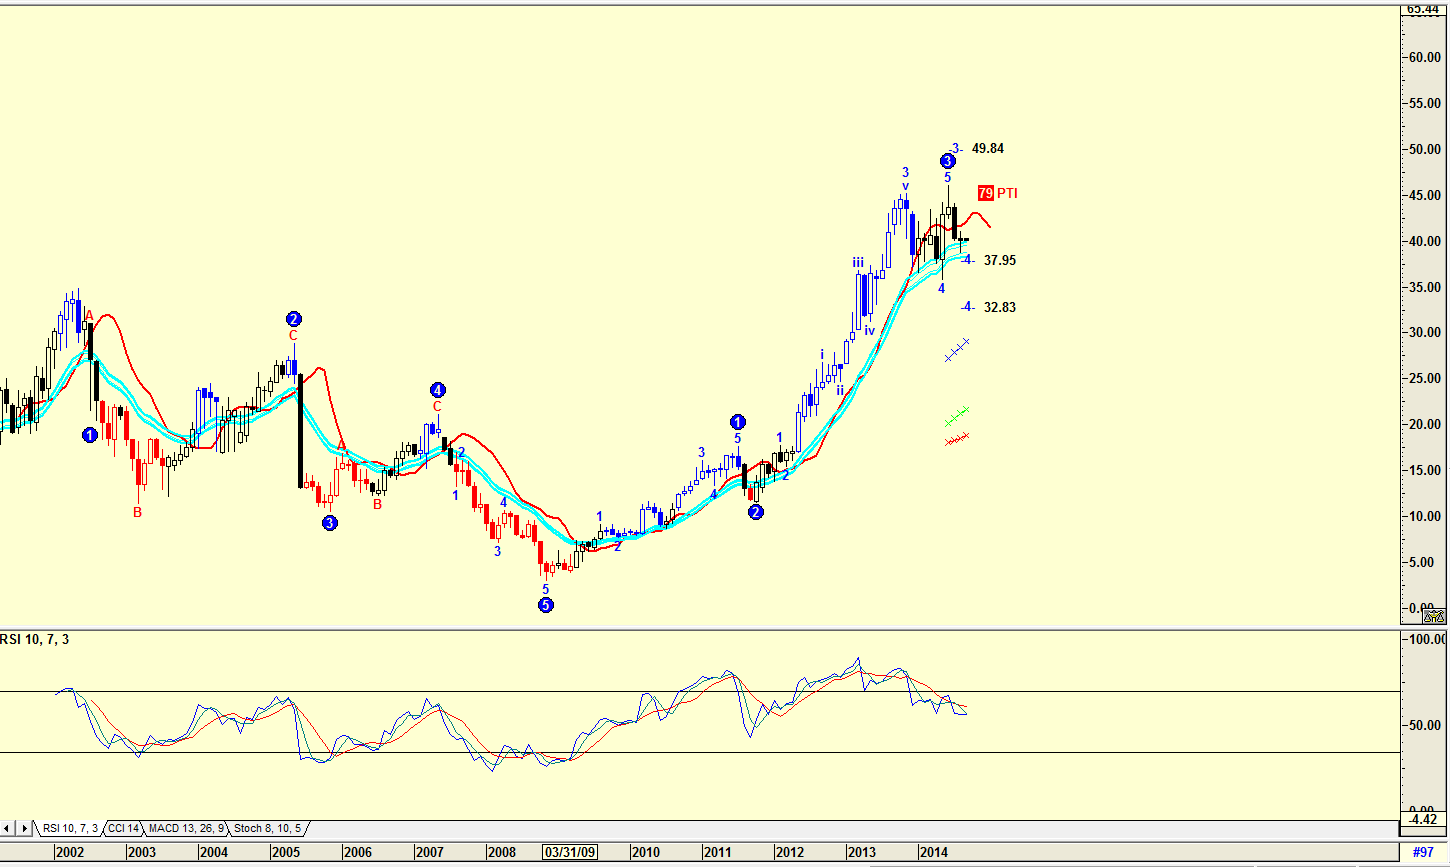
| Figure 1. Monthly chart with Elliott Wave count. |
| Graphic provided by: AdvancedGET. |
| |
| The chart in Figure 1 is a monthly chart with an Elliott Wave count suggesting that the stock should fall to either $37.95 or $32.83 to complete a Wave 4. The probability index (PTI) at 79 is extremely strong. The chart is also suggesting that the wave 3 may not be complete with a wave 3 target should the share start rising at $49.84. However, with a falling relative strength index (RSI), this seems unlikely. |

|
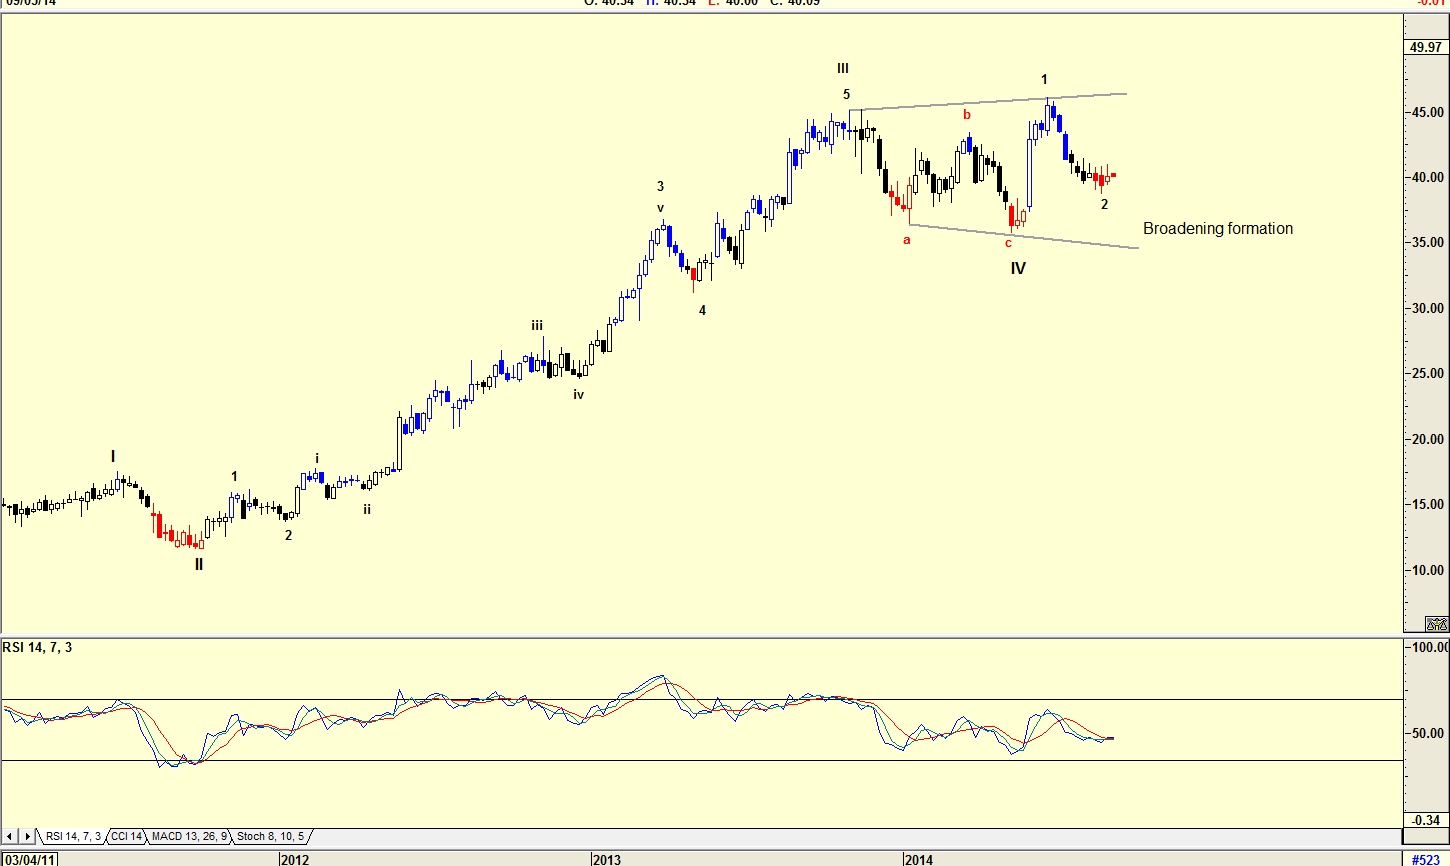
| Figure 2. Weekly chart showing a broadening formation. |
| Graphic provided by: AdvancedGET. |
| |
| The weekly chart on the other hand, in Figure 2, is suggesting that the share price has completed a Wave 2 of a WAVE V. With the RSI indecisive, and the broadening formation that has formed, you can look at the chart with caution, but it definitely is triggering a 'watch me' scenario. A broadening formation is where the highs make higher highs and the lows make lower lows. This is a sign of uncertainty. |

|
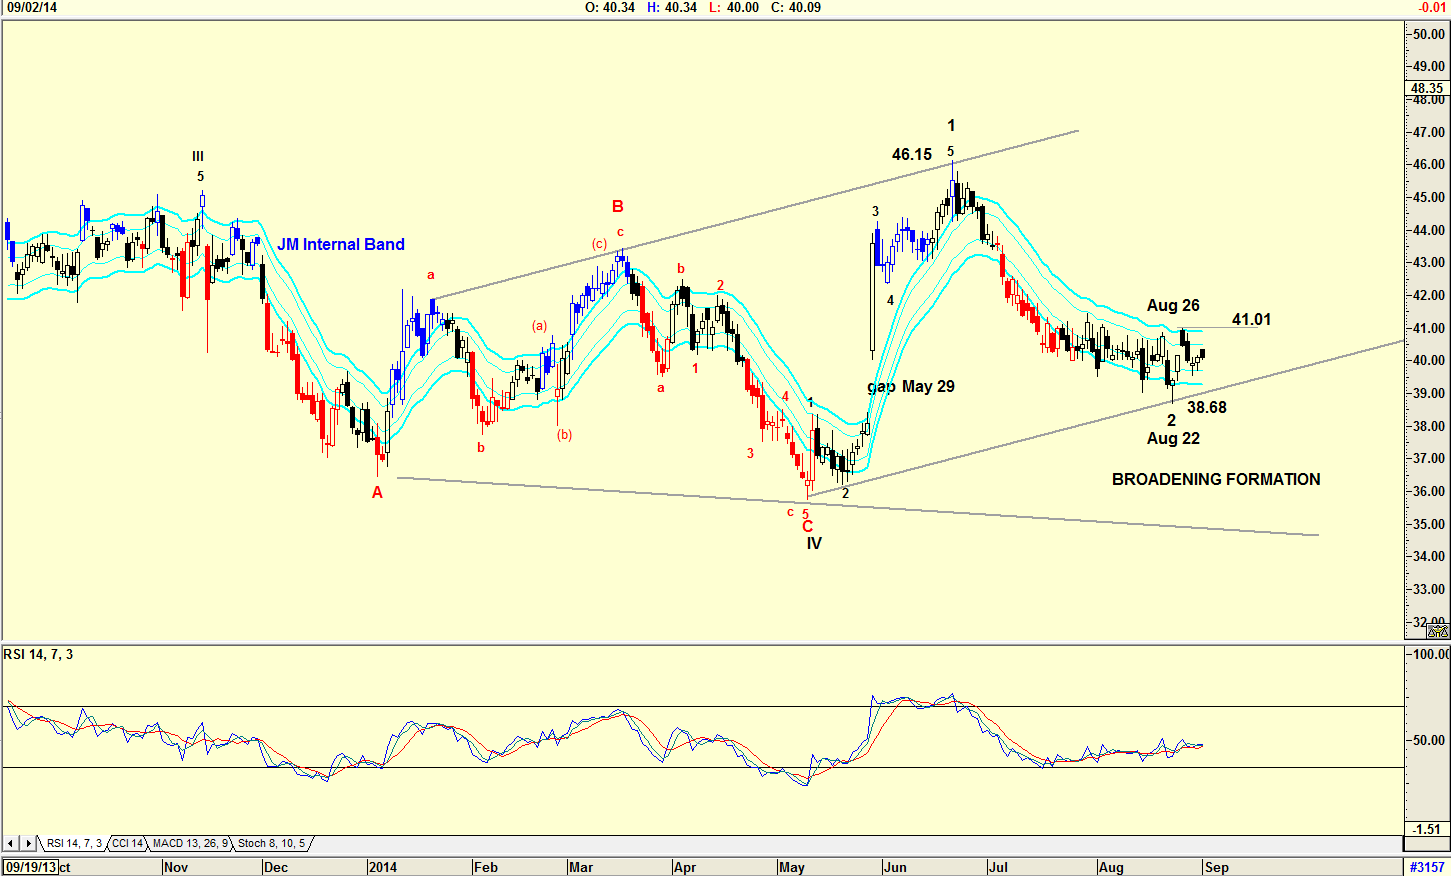
| Figure 3. Daily chart suggesting a buy signal could soon be triggered. |
| Graphic provided by: AdvancedGET. |
| |
| Figure 3 is the daily chart showing the broadening formation reflecting uncertainty. The chart also shows the gap that formed on May 29, 2014. The share price rose to the upper band of the broadening formation at $46.15 completing what could be Wave 1 of WAVE V. The share price then fell to $38.68 by August 22, 2014 filling the gap, and suggesting that a Wave 2 of WAVE V has formed. This bottom, if genuine — and it appears to be genuine because the support line shown parallels the upper resistance line — suggests that the share price will rise to retest and possibly break above the $46.15 level of Wave 1 of WAVE V. With the RSI looking positive, the share price looks like a buy. However, I would prefer to wait for the price to move above the high of August 26, 2014 at $41.01. Conservative investors could wait for a move above the upper JM Internal Band indicator. Note that the price of $41.01 is testing the upper JM Internal Band. The JM Internal Band is a 15-period simple moving average offset by 2% positive and 2% negative. The share price of PLKI looks interesting and could be a buy in the near future. Having a look at a stock recommendation you heard on TV can be worth the effort. |
Has been a technical analyst since 1969, and has worked as a futures and options trader with First Financial Futures in Johannesburg, South Africa.
| Address: | 3256 West 24th Ave |
| Vancouver, BC | |
| Phone # for sales: | 6042634214 |
| E-mail address: | petroosp@gmail.com |
Click here for more information about our publications!
PRINT THIS ARTICLE

Request Information From Our Sponsors
- VectorVest, Inc.
- Executive Premier Workshop
- One-Day Options Course
- OptionsPro
- Retirement Income Workshop
- Sure-Fire Trading Systems (VectorVest, Inc.)
- Trading as a Business Workshop
- VectorVest 7 EOD
- VectorVest 7 RealTime/IntraDay
- VectorVest AutoTester
- VectorVest Educational Services
- VectorVest OnLine
- VectorVest Options Analyzer
- VectorVest ProGraphics v6.0
- VectorVest ProTrader 7
- VectorVest RealTime Derby Tool
- VectorVest Simulator
- VectorVest Variator
- VectorVest Watchdog
- StockCharts.com, Inc.
- Candle Patterns
- Candlestick Charting Explained
- Intermarket Technical Analysis
- John Murphy on Chart Analysis
- John Murphy's Chart Pattern Recognition
- John Murphy's Market Message
- MurphyExplainsMarketAnalysis-Intermarket Analysis
- MurphyExplainsMarketAnalysis-Visual Analysis
- StockCharts.com
- Technical Analysis of the Financial Markets
- The Visual Investor
