

HOT TOPICS LIST
- MACD
- Fibonacci
- RSI
- Gann
- ADXR
- Stochastics
- Volume
- Triangles
- Futures
- Cycles
- Volatility
- ZIGZAG
- MESA
- Retracement
- Aroon
INDICATORS LIST
LIST OF TOPICS
PRINT THIS ARTICLE
by Donald W. Pendergast, Jr.
Shares of LRAD Corporation are now at a three year high, with great long-term money flows suggesting even higher prices ahead.
Position: N/A
Donald W. Pendergast, Jr.
Freelance financial markets writer and online publisher of the Trendzetterz.com S&P 500 Weekly Forecast service.
PRINT THIS ARTICLE
ACCUM./DIST. CHAIKIN
LRAD: Strong Weekly Money Flows
09/03/14 04:08:14 PMby Donald W. Pendergast, Jr.
Shares of LRAD Corporation are now at a three year high, with great long-term money flows suggesting even higher prices ahead.
Position: N/A
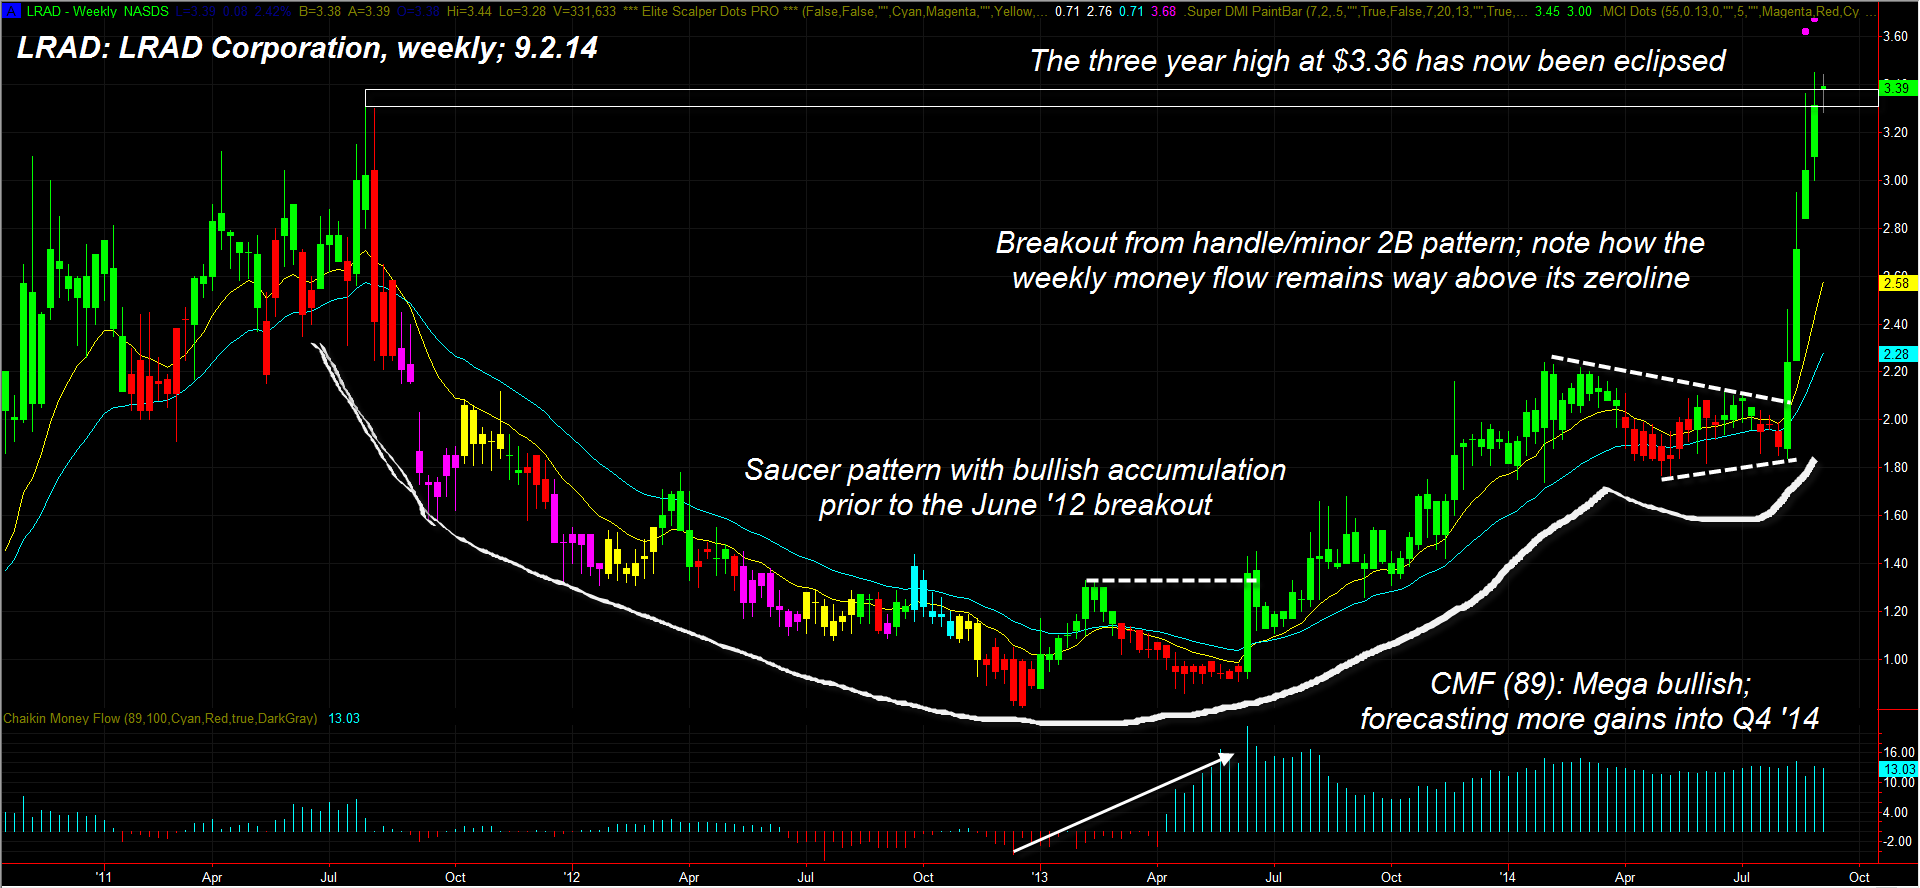
| The price action in the aftermath of a 30-month long saucer pattern in shares of LRAD Corporation (LRAD) continues to show tremendous bullish follow through; here's a closer look at the dynamics surrounding this consumer cyclical sector issue, focusing on its weekly chart (Figure 1). |
|
| Figure 1. Spectacular bullish price action in the post-saucer era of LRAD may be hinting at even greater gains to be seen in the weeks and months ahead. Long-term money flows remain very strong. |
| Graphic provided by: TradeStation. |
| Graphic provided by: Elite Trader Indicators by Fibozachi.com. |
| |
| Saucer patterns in liquid stocks aren't the kind that pop up on technical charts with any amount of regularity, but when they finally appear, they begin flashing certain telltale signs that the big institutional traders and investors are taking a major interest in acquiring shares. In the chart in Figure 1, note how LRAD experienced a rapid surge of accumulation — based on its 89-week Chaikin Money Flow (CMF)(89) histogram — even as the stock was declining in the first half of 2013 in search of a valid double bottom confirmation. This was the visual tip-off that the big mutual funds, banks, pension funds, and hedge funds were stepping up to the plate, fully expecting to be rewarded (in due time) with healthy capital gains on their investments. Not long afterward, in June 2013, LRAD experienced a bullish breakout that confirmed that the saucer would most likely begin to slope upward, offering even more opportunities to scale in, swing trade, or even hold on for a longer term trending move. Two key technicals can often help keep a trader/investor in a long position in a breakout issue like LRAD: 1. Steadily bullish long-term money flows (CMF) using values of 89, 100, 120, and 144. 2. Increasing spreads between two significant exponential or simple moving averages, such as the 13/34, 21/55 or 34/89 combinations. 3. If the dynamics present on point 1 and 2 are also occurring on adjacent chart time frames, so much the better. LRAD pulled back and/or consolidated for the first half of 2014, finally putting in a minor double bottom pattern by July 2014 — a sort of handle for the large saucer — after which a massive bullish breakout occurred in early August 2014. When giant weekly patterns like this emerge, thousands of traders will be continually monitoring it for breakout opportunities, making such breaks very powerful. Not all are successful, of course, but LRAD's recent rally has been incredible, and the long-term money flows are still way above their zero line even as the stock has just taken out its three year high at $3.36/share. Some traders and investors get nervous seeing a stock at an all time high like this, but since the money flow is so robust the line of least resistance for LRD is still heavily biased toward higher prices. Institutional traders account for 80% of all trading volumes, so it must be assumed that they are going to sit tight for now, fully expecting LRAD to tack on even more gains as the stock begins to attract more retail traders and investors. Bear in mind that LRAD has been in a technical uptrend since January 2009, based on a pattern of higher weekly swing highs and higher weekly swing lows. |
|
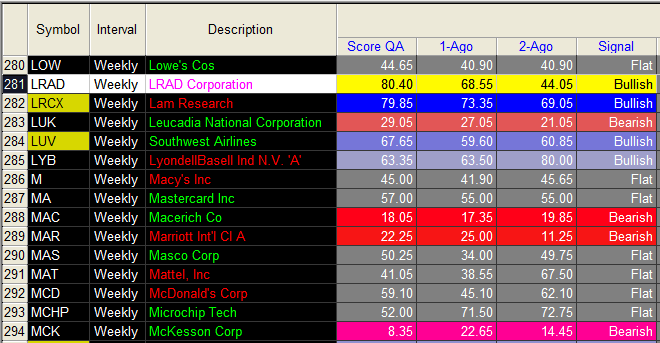
| Figure 2. LRAD's fundamental ranking score has made a rapid, bullish surge over the past two weeks. |
| Graphic provided by: TradeStation. |
| Graphic provided by: TradeStation RadarScreen. |
| |
| LRAD's fundamental attributes are also in complete agreement with the recent rally; using the TradeStation Fundamental Score Ranker in RadarScreen (Figure 2), it becomes apparent that the stock's score has dramatically improved over the past two weeks, surging from 44.05 to 68.55 and then to the current value of 80.40. Given the technical/fundamental bias toward higher prices ahead, one of the best ways to play LRAD here is to drop to a 30 or 60-minute chart, looking for the next pullback to support and then putting on a long swing trade. Plan on holding overnight in order to maximize the potential for gain even as you only allocate a small portion of your trading capital to this setup. By some measures LRAD is overbought; but by using a smaller time frame you can eliminate a portion of such a risk. The fundamentals and technicals on the weekly chart are great, so you have a powerful bullish bias on your side, regardless of the time frame. Trade wisely until we meet here again. |
Freelance financial markets writer and online publisher of the Trendzetterz.com S&P 500 Weekly Forecast service.
| Title: | Market consultant and writer |
| Company: | Trendzetterz |
| Address: | 81 Hickory Hollow Drive |
| Crossville, TN 38555 | |
| Phone # for sales: | 904-303-4814 |
| Website: | trendzetterz.com |
| E-mail address: | support@trendzetterz.com |
Traders' Resource Links | |
| Trendzetterz has not added any product or service information to TRADERS' RESOURCE. | |
Click here for more information about our publications!
PRINT THIS ARTICLE

Request Information From Our Sponsors
- VectorVest, Inc.
- Executive Premier Workshop
- One-Day Options Course
- OptionsPro
- Retirement Income Workshop
- Sure-Fire Trading Systems (VectorVest, Inc.)
- Trading as a Business Workshop
- VectorVest 7 EOD
- VectorVest 7 RealTime/IntraDay
- VectorVest AutoTester
- VectorVest Educational Services
- VectorVest OnLine
- VectorVest Options Analyzer
- VectorVest ProGraphics v6.0
- VectorVest ProTrader 7
- VectorVest RealTime Derby Tool
- VectorVest Simulator
- VectorVest Variator
- VectorVest Watchdog
- StockCharts.com, Inc.
- Candle Patterns
- Candlestick Charting Explained
- Intermarket Technical Analysis
- John Murphy on Chart Analysis
- John Murphy's Chart Pattern Recognition
- John Murphy's Market Message
- MurphyExplainsMarketAnalysis-Intermarket Analysis
- MurphyExplainsMarketAnalysis-Visual Analysis
- StockCharts.com
- Technical Analysis of the Financial Markets
- The Visual Investor