HOT TOPICS LIST
- MACD
- Fibonacci
- RSI
- Gann
- ADXR
- Stochastics
- Volume
- Triangles
- Futures
- Cycles
- Volatility
- ZIGZAG
- MESA
- Retracement
- Aroon
INDICATORS LIST
LIST OF TOPICS
PRINT THIS ARTICLE
by Thomas Bopp
Everyone needs a vacation and Vail Resorts satisfies this need, especially in the winter. The stock is close to a historic high and everything points to the possibility of it reaching $100 by the end of the year.
Position: Accumulate
Thomas Bopp
Thomas Bopp has more than 25 years experience in all kinds of trading. He mainly trades options on the short-side based on his own unique trading systems. He is also responsible for a German and Spanish free daily market newsletter, which covers the S&P 500, Ibex 35, DAX and German Bund-Future.
PRINT THIS ARTICLE
BREAKOUTS
Vail Resorts Breaking Out?
09/03/14 10:05:29 PMby Thomas Bopp
Everyone needs a vacation and Vail Resorts satisfies this need, especially in the winter. The stock is close to a historic high and everything points to the possibility of it reaching $100 by the end of the year.
Position: Accumulate
| The general technical picture of Vail Resorts (MTN) shows strength. After the high of 2007 was tested and defended, the stock bounced off this new support at $65, and today it stands close to an all-time high. The last few days saw some profit-taking, while the stock traded above the highs twice since July 2014. Seasonal behavior for the next months indicate that this stock could run up further. |

|
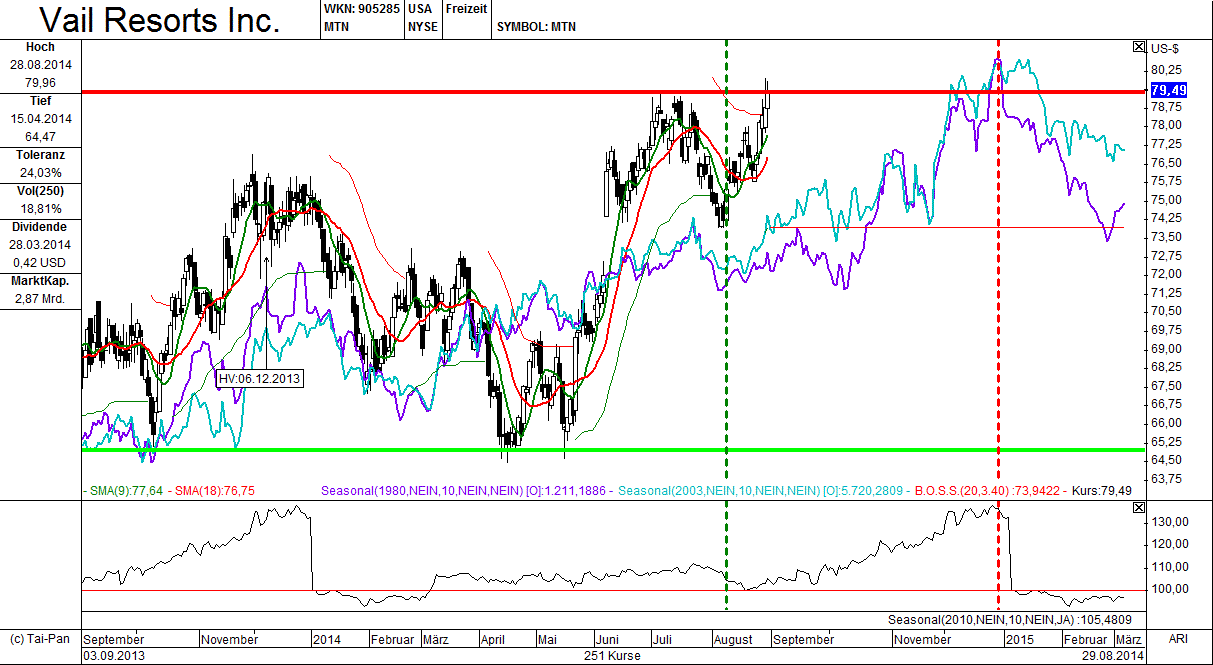
| Figure 1. Vail Resorts (MTN) tries to get through its resistance level. Seasonality points to further highs until the end of 2014. In line with seasonal expectations, prices hit a low in early August. |
| Graphic provided by: www.lp-software.de. |
| |
| The chart in Figure 1 is a short-term chart with seasonal markings. The dotted green vertical line refers to a seasonal low, which marked the end of a down move. The end of a seasonal strong time is indicated by the dotted red vertical line. There are two additional lines and an indicator window. The turquoise seasonal line is calculated using data from the past 10 years. The purple seasonal line is calculated using data from 1980. The indicator window is calculated using data from the last three years. All three lines point to rising prices. If the stock exceeds $80, a short-term target emerges at $85. Support comes from the weekly chart (Figure 2). |

|
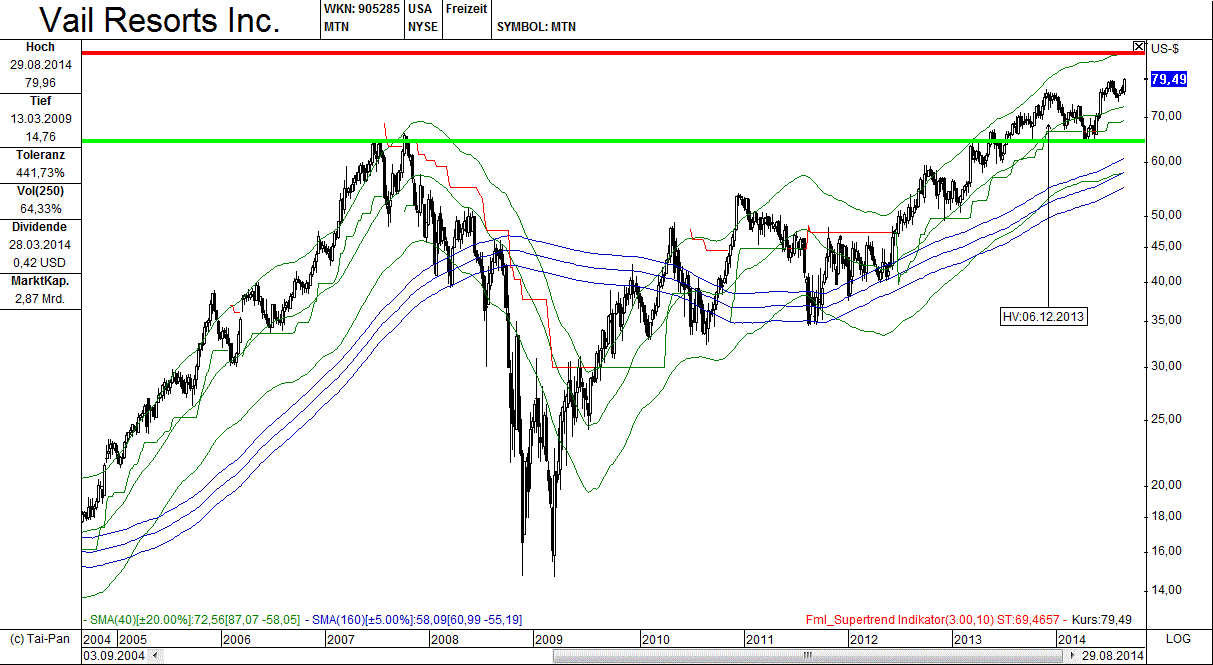
| Figure 2. Applying envelopes around the 200-period simple moving average gives us an idea of the price target. The upper 200 period simple moving average envelope suggests a price target of $85, which is a conservative target. A target of $100 is more likely in the longer term. |
| Graphic provided by: www.lp-software.de. |
| |
| On the weekly chart, I have inserted two envelopes. The green envelope is calculated based on the 200-period simple moving average (SMA). The upper envelope is 20% above the 200-period SMA and serves to indicate a minimum target. If price breaks above this upper envelope, you can expect the stock to reach a target price of $85. This confirms the target from the shorter timeframe. A stop-loss should be placed under the 200-period SMA, while a second stop should be placed at $69.80, as indicated by the green calculated super-trend-indicator. This stop & reverse system is calculated using three standard deviations based on the last 14 days. In the long-term, MTN should be a good investment. In 2009, it traded down to $16. If you use the distance from the low to the green former resistance line and mirror it to the upside, the stock has long-term potential to rise further in the upcoming years to at least $114. |
Thomas Bopp has more than 25 years experience in all kinds of trading. He mainly trades options on the short-side based on his own unique trading systems. He is also responsible for a German and Spanish free daily market newsletter, which covers the S&P 500, Ibex 35, DAX and German Bund-Future.
| Title: | Freelance trader and analyst |
| Company: | Bopp's Financial Market Studies |
| Address: | Eichendorffweg 6 |
| 61194 Niddatal, Germany, 61194 | |
| Phone # for sales: | +49 60347961 |
| E-mail address: | webmaster@zyklusanalyst.de |
Traders' Resource Links | |
| Bopp's Financial Market Studies has not added any product or service information to TRADERS' RESOURCE. | |
Click here for more information about our publications!
PRINT THIS ARTICLE

Request Information From Our Sponsors
- StockCharts.com, Inc.
- Candle Patterns
- Candlestick Charting Explained
- Intermarket Technical Analysis
- John Murphy on Chart Analysis
- John Murphy's Chart Pattern Recognition
- John Murphy's Market Message
- MurphyExplainsMarketAnalysis-Intermarket Analysis
- MurphyExplainsMarketAnalysis-Visual Analysis
- StockCharts.com
- Technical Analysis of the Financial Markets
- The Visual Investor
- VectorVest, Inc.
- Executive Premier Workshop
- One-Day Options Course
- OptionsPro
- Retirement Income Workshop
- Sure-Fire Trading Systems (VectorVest, Inc.)
- Trading as a Business Workshop
- VectorVest 7 EOD
- VectorVest 7 RealTime/IntraDay
- VectorVest AutoTester
- VectorVest Educational Services
- VectorVest OnLine
- VectorVest Options Analyzer
- VectorVest ProGraphics v6.0
- VectorVest ProTrader 7
- VectorVest RealTime Derby Tool
- VectorVest Simulator
- VectorVest Variator
- VectorVest Watchdog
