HOT TOPICS LIST
- MACD
- Fibonacci
- RSI
- Gann
- ADXR
- Stochastics
- Volume
- Triangles
- Futures
- Cycles
- Volatility
- ZIGZAG
- MESA
- Retracement
- Aroon
INDICATORS LIST
LIST OF TOPICS
PRINT THIS ARTICLE
by Koos van der Merwe
Is it time to start nibbling at Facebook (FB) shares again? My charts are not sure which way to go.
Position: Sell
Koos van der Merwe
Has been a technical analyst since 1969, and has worked as a futures and options trader with First Financial Futures in Johannesburg, South Africa.
PRINT THIS ARTICLE
ELLIOTT WAVE
Nibbling At Facebook
09/03/14 03:48:52 PMby Koos van der Merwe
Is it time to start nibbling at Facebook (FB) shares again? My charts are not sure which way to go.
Position: Sell
| Shares of Facebook (FB) are either loved or hated. Trying to find any news about the company comes up with nothing new. This week, CNBC reported that a major financial company downgraded the share price. Knowing all this, when a buy signal is triggered should you take the risk and buy shares? |

|
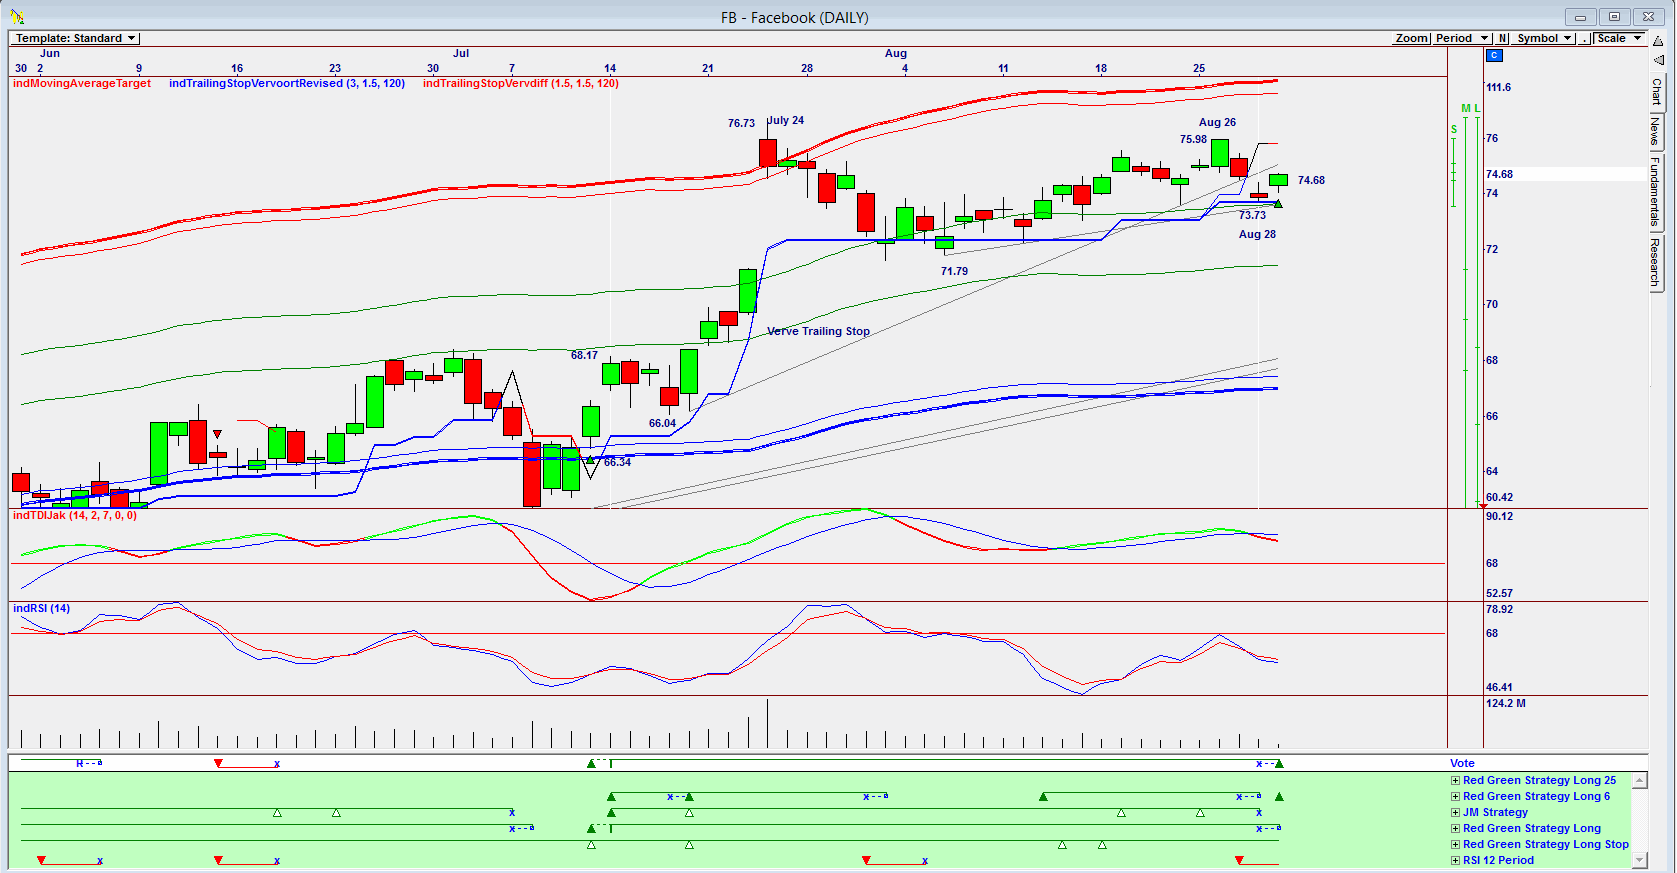
| Figure 1. Omnitrader chart showing a buy signal. |
| Graphic provided by: Omnitrader. |
| |
| The chart in Figure 1 is an Omnitrader chart that shows a buy signal given on the share price at 12 pm on August 29, 2014. The chart shows a buy signal on July 11, 2014 when the price was $66.34 based on the Red Green Strategy Long and the Red Green Strategy Long stop shown in green below the vote line. Two other strategies gave buy signals a day later. The price rose to $68.17, then fell to $66.04 before rising to $76.73 by July 24, 2014. The price then fell to $71.79 testing the Verve trailing stop, but not giving a sell signal. The price then rose to $75.98 by August 26, 2014 and fell to $73.73 by August 28, 2014 triggering a stop loss signal based on the 12-period RSI strategy. Once again the Verve trailing stop was tested but not penetrated. However a buy signal based on the Red Green Strategy Long 6 supported by the Red Green Strategy Long stop was given on the share price of $74.68 at 12 pm on August 29, 2014. |

|
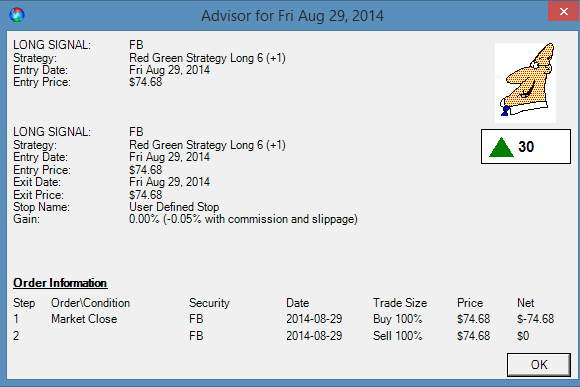
| Figure 2. Advisor rating. |
| Graphic provided by: Omnitrader. |
| |
| The Advisor Rating shown in Figure 2 is 30, which is not a very strong rating. An Advisor rating of 32 is usually the lowest rating to be considered. |

|
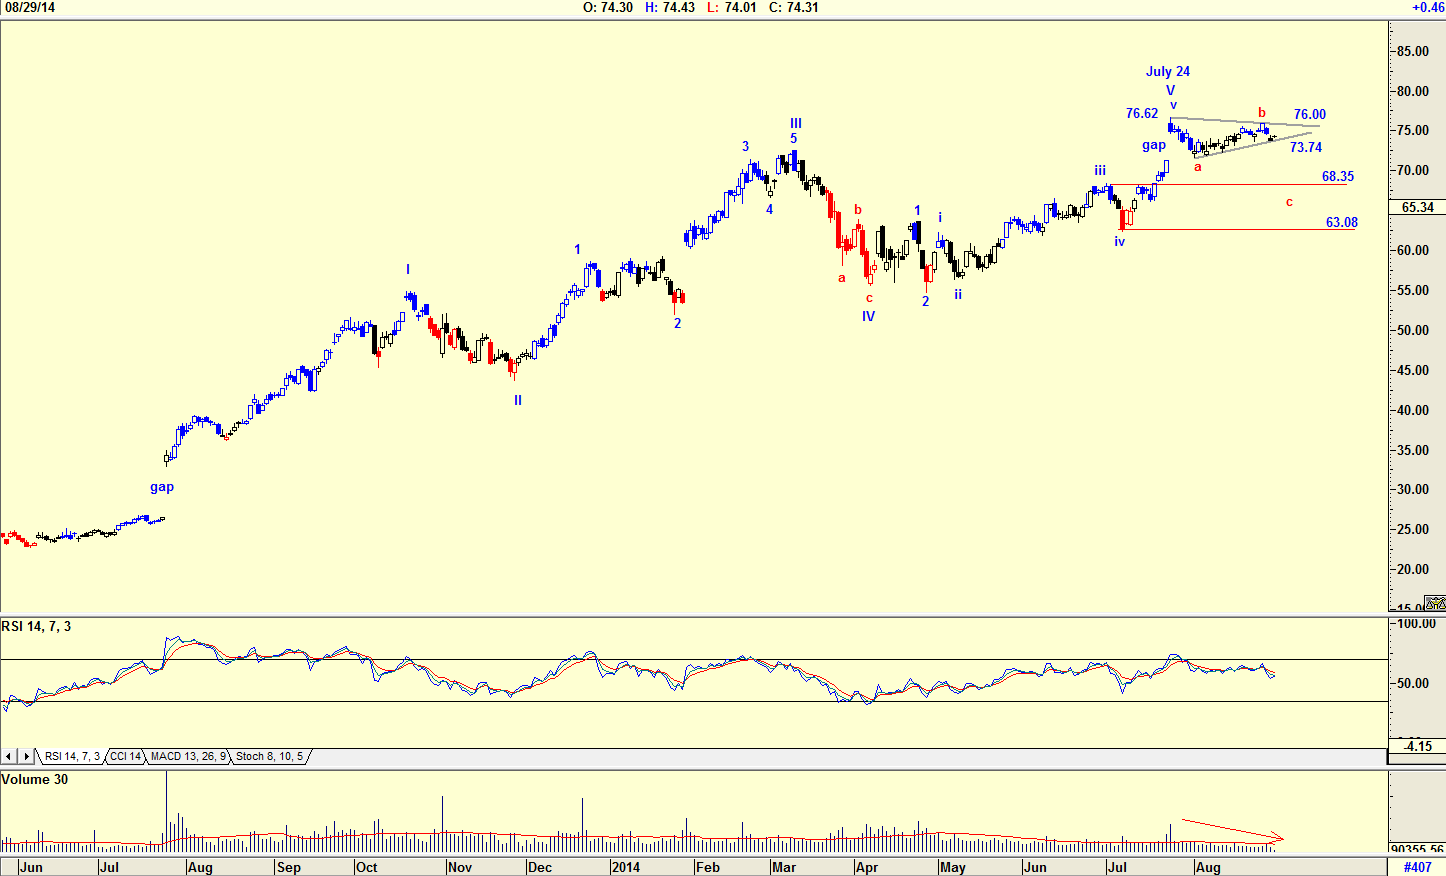
| Figure 3. Elliott Wave count. |
| Graphic provided by: AdvancedGET. |
| |
| Looking at the chart in Figure 3 with an Elliott Wave count, where the chart suggests a WAVE V was completed on July 24, 2014 the abc correction looks flat with the relative strength index (RSI) suggesting further downside. However, volume has fallen as the price fell, suggesting strength. Note on the chart the resistance level of $76 and a support at $73.74. Should the share price drop below $73.74, it should fall to somewhere between $63.08 and $68.35, the 4th wave of lesser degree. The Omnitrader chart is suggesting a buy. The Advisor rating is a weak buy, suggesting that you should not consider the buy signal given. The Elliott Wave analysis is suggesting a downward correction could occur. I would not be a buyer of FB shares at the moment but rather sit on the sidelines and wait to see if the share breaks above the $76 level. If it does, then I may consider buying and holding the share until a sell signal is given. |
Has been a technical analyst since 1969, and has worked as a futures and options trader with First Financial Futures in Johannesburg, South Africa.
| Address: | 3256 West 24th Ave |
| Vancouver, BC | |
| Phone # for sales: | 6042634214 |
| E-mail address: | petroosp@gmail.com |
Click here for more information about our publications!
PRINT THIS ARTICLE

Request Information From Our Sponsors
- StockCharts.com, Inc.
- Candle Patterns
- Candlestick Charting Explained
- Intermarket Technical Analysis
- John Murphy on Chart Analysis
- John Murphy's Chart Pattern Recognition
- John Murphy's Market Message
- MurphyExplainsMarketAnalysis-Intermarket Analysis
- MurphyExplainsMarketAnalysis-Visual Analysis
- StockCharts.com
- Technical Analysis of the Financial Markets
- The Visual Investor
- VectorVest, Inc.
- Executive Premier Workshop
- One-Day Options Course
- OptionsPro
- Retirement Income Workshop
- Sure-Fire Trading Systems (VectorVest, Inc.)
- Trading as a Business Workshop
- VectorVest 7 EOD
- VectorVest 7 RealTime/IntraDay
- VectorVest AutoTester
- VectorVest Educational Services
- VectorVest OnLine
- VectorVest Options Analyzer
- VectorVest ProGraphics v6.0
- VectorVest ProTrader 7
- VectorVest RealTime Derby Tool
- VectorVest Simulator
- VectorVest Variator
- VectorVest Watchdog
