HOT TOPICS LIST
- MACD
- Fibonacci
- RSI
- Gann
- ADXR
- Stochastics
- Volume
- Triangles
- Futures
- Cycles
- Volatility
- ZIGZAG
- MESA
- Retracement
- Aroon
INDICATORS LIST
LIST OF TOPICS
PRINT THIS ARTICLE
by Koos van der Merwe
When the technicals of a stock suggest a buy, do you buy?
Position: Buy
Koos van der Merwe
Has been a technical analyst since 1969, and has worked as a futures and options trader with First Financial Futures in Johannesburg, South Africa.
PRINT THIS ARTICLE
TECHNICAL ANALYSIS
Is It Time To Buy Cisco Systems?
08/29/14 03:29:56 PMby Koos van der Merwe
When the technicals of a stock suggest a buy, do you buy?
Position: Buy
| In 2001, Cisco systems was trading at the $75 level, then it fell as the dot.com bubble burst to a low of $8.50. Since then the stock has been trading in a sideways range rising to a high of $34.68 and testing the low of $13.77. Is the share, at the current price of $24.81 suggesting a buy? |

|
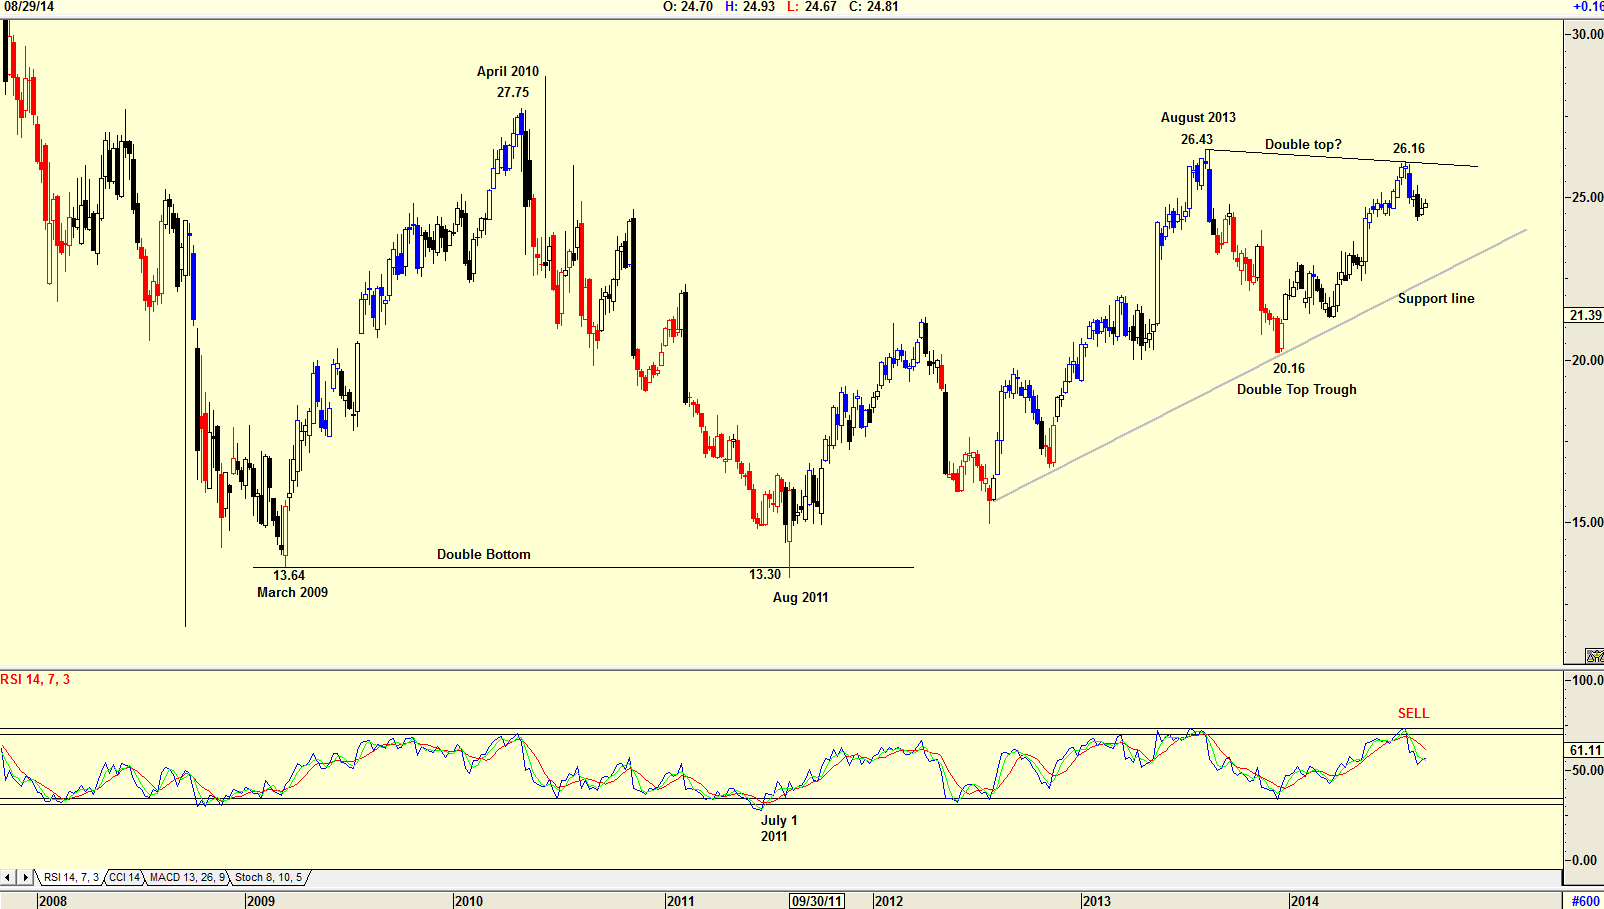
| Figure 1. Weekly chart showing double bottom and possible double top. |
| Graphic provided by: AdvancedGET. |
| |
| The weekly chart in Figure 1 shows price forming a double bottom at the $13.30-13.64 level. Double bottoms represent buying opportunities and as you can see on the chart, the share price started to rise as the RSI indicator suggested a buy on July 1, 2011. The price since then has risen to a high of $26.43 by August 2013. However, a double top appears to have formed at $26.16. The rule is that only when the price falls below the double top trough at $20.16 is the share considered a sell. The support line shown on the chart could provide strong resistance to a fall to $20.16. However, note the 14-period relative strength index (RSI)(14) is suggesting weakness. |

|
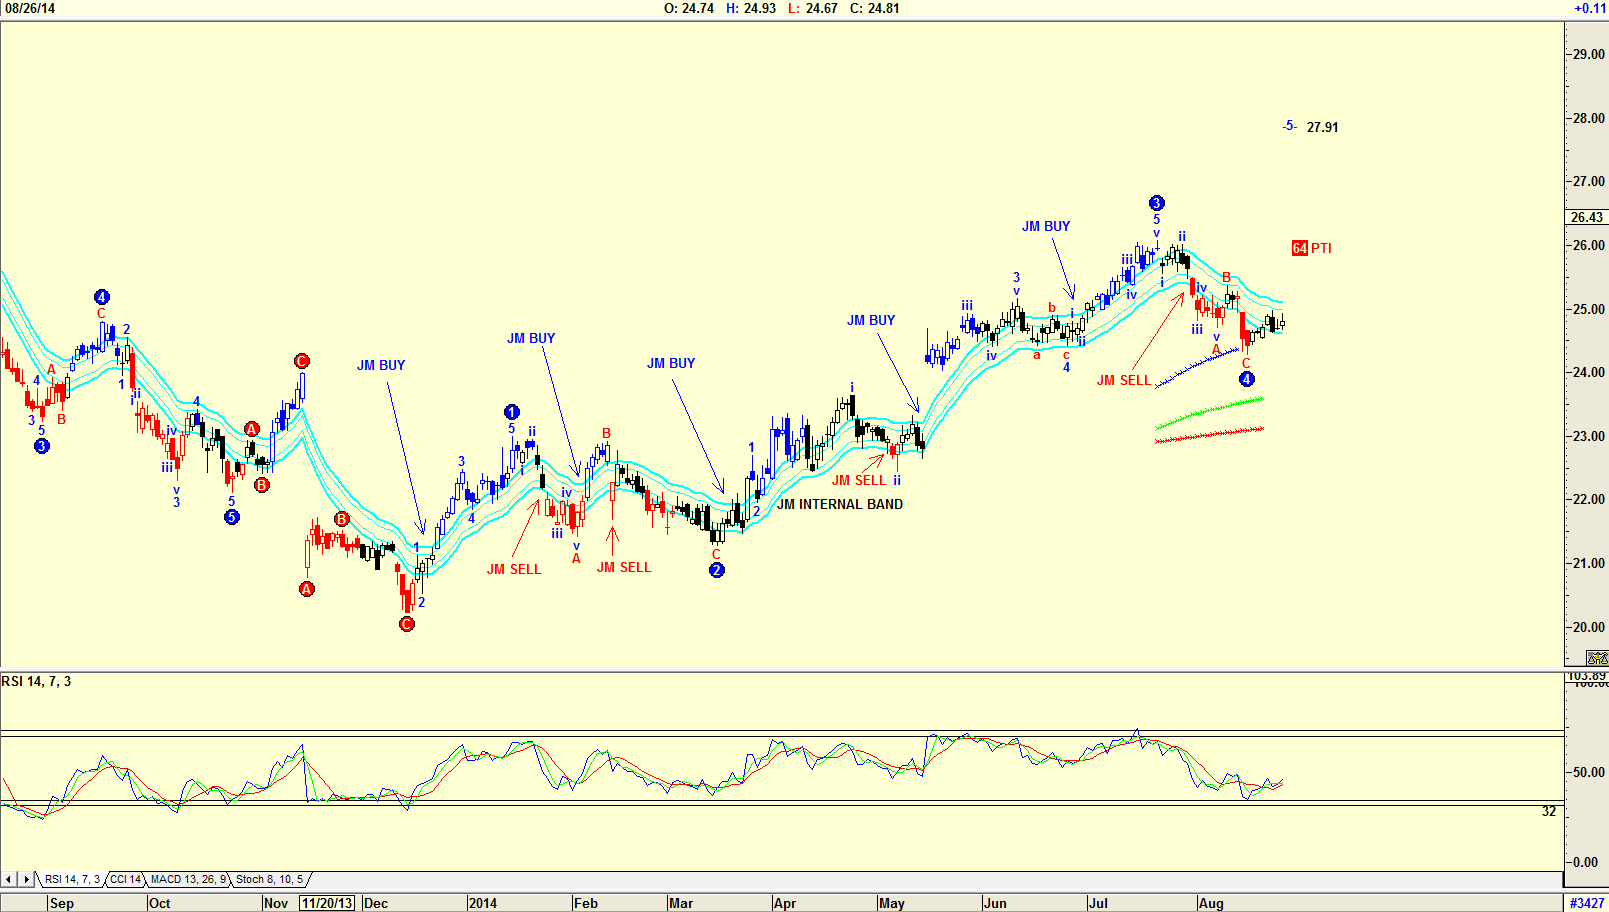
| Figure 2. Daily chart showing a JM Internal Band and Elliott Wave count. |
| Graphic provided by: AdvancedGET. |
| |
| The chart in Figure 2 is a daily chart with an Elliott Wave count suggesting that the share price could be moving into a WAVE 5 with a target of $27.91. The probability index (PTI) at 64 is strong suggesting that the target price could indeed be reached. The RSI is not suggesting a buy signal. It has not fallen below the 32 horizontal line and then retraced above it. Also the price is still below the upper band of the JM Internal Band indicator. A rise above the upper band will suggest a buy. The JM Internal Band is a 15-period simple moving average offset by 2% positive and 2% negative. |

|
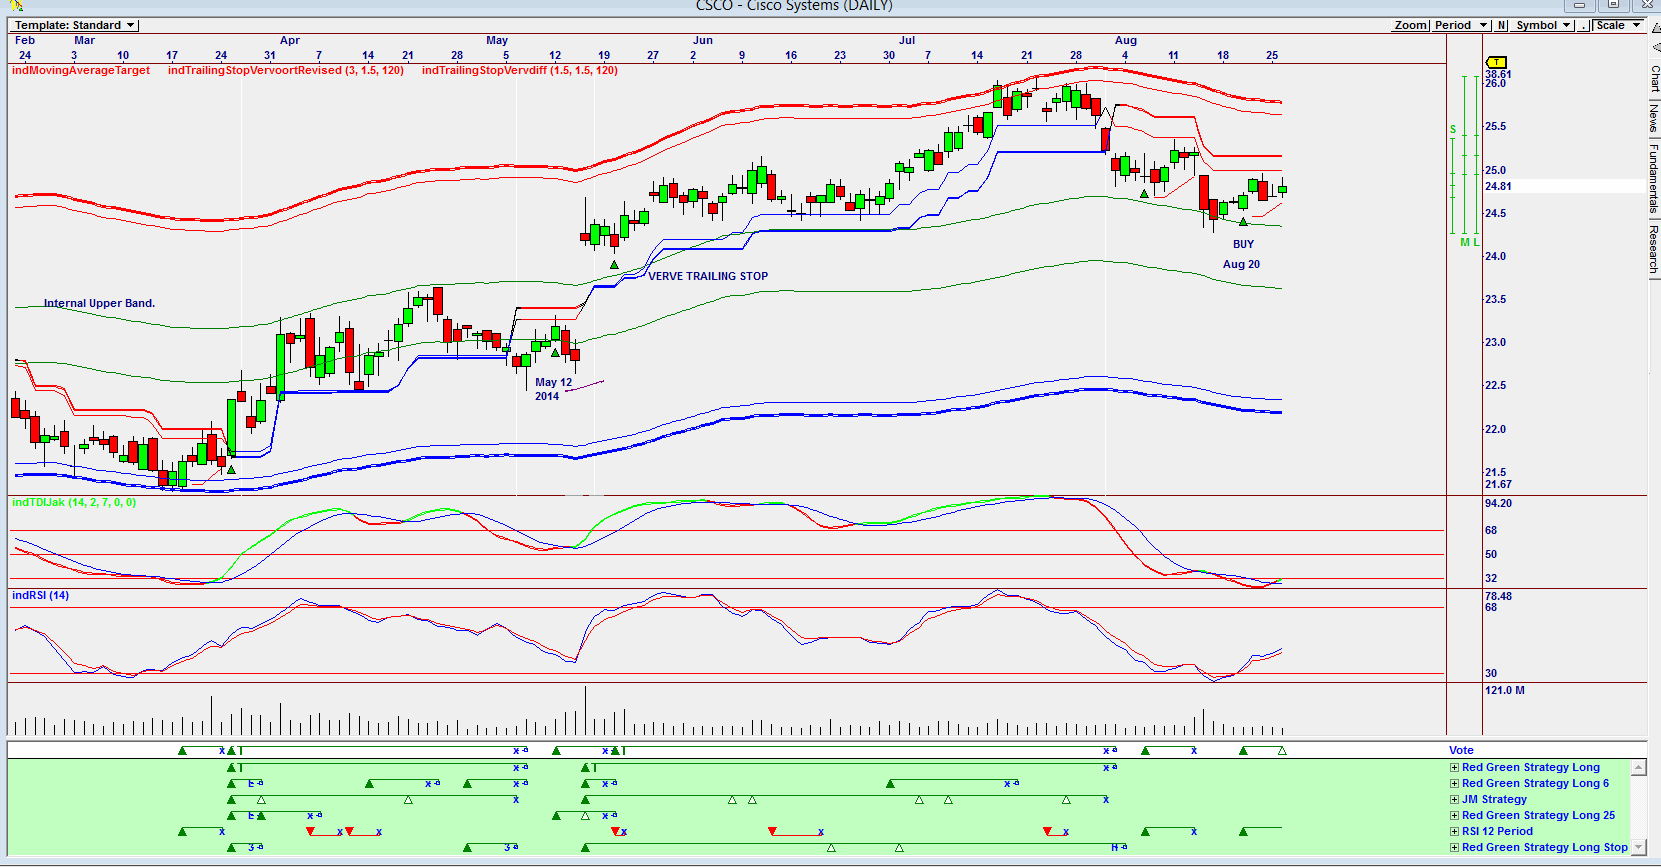
| Figure 3. Omnitrader chart showing Vote line buy signals. |
| Graphic provided by: Omnitrader. |
| |
| The chart in Figure 3 is an Omnitrader chart showing a Vote line that suggested a buy signal on August 20, 2014 based on the RSI(12) strategy shown in green below the Vote line. This is a weak buy signal. Previous buy signals on the Vote line were made by five strategies suggesting a buy. The exception is the signal given on May 12, 2014 which was given by the Red Green Strategy Long 25. Note the TDIJak indicator is suggesting a buy four days after the RSI indicator's buy signal. Note that the price found support at the internal upper band. Yes, I would be a buyer of CSCO at the present price but with only 50% of the cash I was prepared to invest. Once I receive more buy signals from other strategies below the Vote line, I would invest the rest of my capital. |
Has been a technical analyst since 1969, and has worked as a futures and options trader with First Financial Futures in Johannesburg, South Africa.
| Address: | 3256 West 24th Ave |
| Vancouver, BC | |
| Phone # for sales: | 6042634214 |
| E-mail address: | petroosp@gmail.com |
Click here for more information about our publications!
PRINT THIS ARTICLE

Request Information From Our Sponsors
- StockCharts.com, Inc.
- Candle Patterns
- Candlestick Charting Explained
- Intermarket Technical Analysis
- John Murphy on Chart Analysis
- John Murphy's Chart Pattern Recognition
- John Murphy's Market Message
- MurphyExplainsMarketAnalysis-Intermarket Analysis
- MurphyExplainsMarketAnalysis-Visual Analysis
- StockCharts.com
- Technical Analysis of the Financial Markets
- The Visual Investor
- VectorVest, Inc.
- Executive Premier Workshop
- One-Day Options Course
- OptionsPro
- Retirement Income Workshop
- Sure-Fire Trading Systems (VectorVest, Inc.)
- Trading as a Business Workshop
- VectorVest 7 EOD
- VectorVest 7 RealTime/IntraDay
- VectorVest AutoTester
- VectorVest Educational Services
- VectorVest OnLine
- VectorVest Options Analyzer
- VectorVest ProGraphics v6.0
- VectorVest ProTrader 7
- VectorVest RealTime Derby Tool
- VectorVest Simulator
- VectorVest Variator
- VectorVest Watchdog
