

HOT TOPICS LIST
- MACD
- Fibonacci
- RSI
- Gann
- ADXR
- Stochastics
- Volume
- Triangles
- Futures
- Cycles
- Volatility
- ZIGZAG
- MESA
- Retracement
- Aroon
INDICATORS LIST
LIST OF TOPICS
PRINT THIS ARTICLE
by Donald W. Pendergast, Jr.
Shares of Netflix have paused slightly, but the bullish swing that commenced two weeks ago is still looking strong.
Position: N/A
Donald W. Pendergast, Jr.
Freelance financial markets writer and online publisher of the Trendzetterz.com S&P 500 Weekly Forecast service.
PRINT THIS ARTICLE
SWING CHART
Netflix: Minor Pause In Strong Bullish Swing
08/28/14 05:04:28 PMby Donald W. Pendergast, Jr.
Shares of Netflix have paused slightly, but the bullish swing that commenced two weeks ago is still looking strong.
Position: N/A
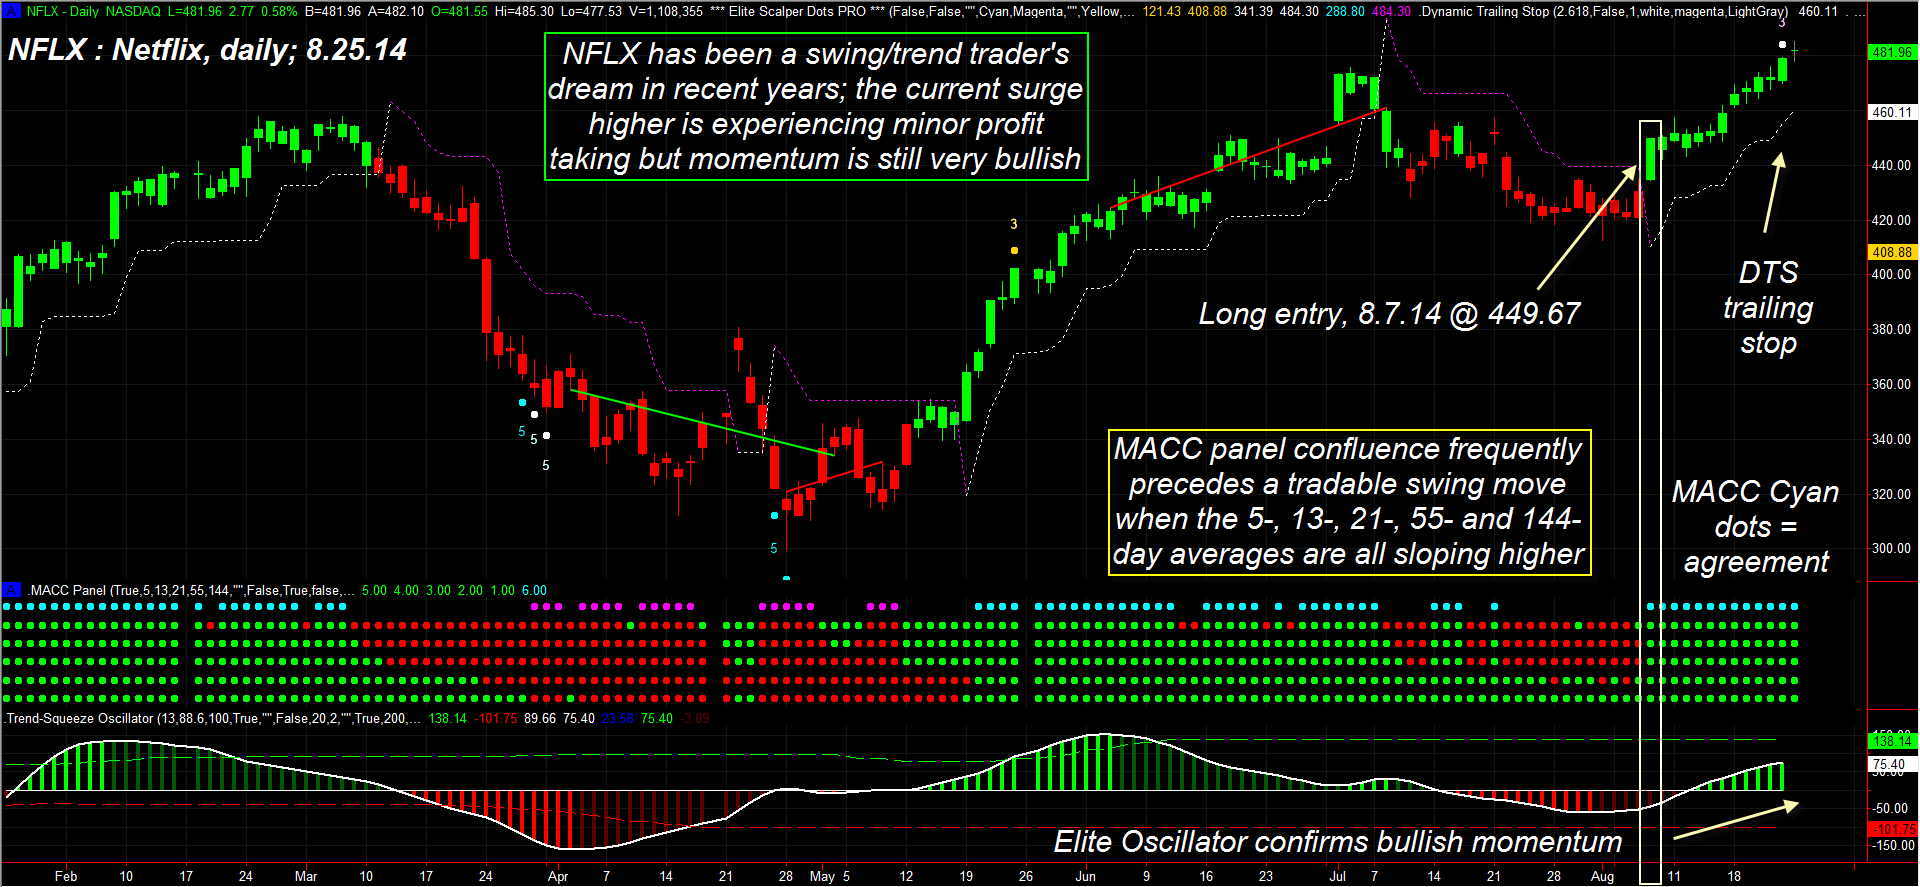
| Swing trading works best when trades are taken in the direction of a higher degree trend at the same time that long-term money flows are also in agreement — whether bullish or bearish. Here's a look at a simple but effective swing trading model that uses key moving averages, money flows, and momentum to determine opportune times to go long or short various stocks on a daily time frame (Figure 1). |
|
| Figure 1. Netflix (NFLX): When five key Fibonacci-derived moving averages began to slope higher in unison on August 7, 2014, the stage was set for the stock's next rally to commence. |
| Graphic provided by: TradeStation. |
| Graphic provided by: Elite Trader Indicators by Fibozachi.com. |
| |
| There are many ways to determine the primary trend of a stock, exchange traded fund (ETF), commodity, or forex instrument, including, but not limited to: 1. Moving averages 2. Keltner channels 3. Linear regression channels 4. Trendlines 5. Price/time cycles 6. Average Directional Movement Index (ADX) and DMI 7. Multiple time frame analysis, using all of the above tools Each of these techniques can prove to be effective, depending on your skill level. In this article, I'll look at an interesting take on how to use multiple moving averages on a daily data series of Netflix (NFLX) to help pinpoint opportune long entry points. The five moving averages are the 5-, 13-, 21-, 55- and 144-day averages; when all five are sloping higher, the moving average control center (MACC) will have a cyan color dot at the top and a stack of five green dots directly below; for NFLX, all five averages began to slope upward on August 7, 2014, with the stock closing at 449.67. This was the primary tipoff that the famed Jesse Livermore "line of least resistance" was most likely toward higher prices for the stock and that the risk of a long entry was minimal at that particular point. There were three other dynamics at work which also confirmed that NFLX was on the verge of yet another rally: A. The Elite oscillator (bottom of chart) was already sloping higher, confirming a different degree of bullish trend. B. The stock closed above the DTS trailing stop line, turning the price bars green. C. The 89-day Chaikin Money Flow histogram (CMF)(89) was above its zero line and rising (not shown to minimize clutter). Now, this all looks pretty basic, but the results in NFLX — so far — appear to confirm the soundness of using an entry confirmation method similar to this one. As of August 25, 2014 NFLX has already made it up to 485.30 — a gain of 7.9% in about 2 1/2 weeks. The old trader's saying is that "momentum precedes price" and this method that trades in line with prevailing trend and momentum (and money flow) seems to be in tune with the goal of achieving a profitable trading outcome. Based on the current trailing stop level of 459.08 (dashed white line), this hypothetical trade is already well into the profit zone; barring a large bearish gap reversal below that trail, this should turn out to be a satisfying swing trade. |
|
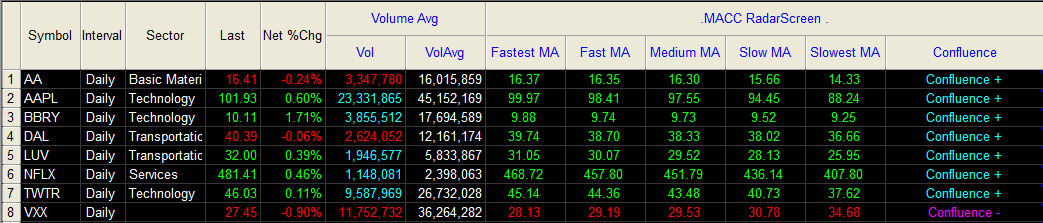
| Figure 2. NFLX is up nearly 8% since the five averages began moving higher together in early August 2014. |
| Graphic provided by: TradeStation. |
| Graphic provided by: TradeStation RadarScreen. |
| |
| Swing trading is simply a truncated version of trend following and the main differences basically amount to this: 1. A tighter trailing stop is used for swing trading 2. A smaller time frame is often employed for swing trading. Other than that, the same basic momentum dynamics discussed earlier apply to both styles of trading; neither style of trade would have gotten you in on the dead low in NFLX that occurred on August 1, 2014 at 412.51 from which the current upswing was birthed, however. But entering there would have been a risky bottom picking attempt at a time when neither the moving averages were in agreement nor was there discernible bullish momentum. Swing trading and trend following will always capture the majority of a major move (perhaps 50 to 70% of it) but will never, ever get you in at the exact low or out at the precise top; this is just one of the real world facts about trading that needs to be accepted and integrated into a successful trader's mindset if he wishes to be consistently profitable in the financial markets. |
| For now, anyone still long NFLX since early August would do well to stay with the trade, running a trailing stop similar to that shown on the chart. The next time you are looking to filter your swing/trend trading opportunities, use at least some of the methods mentioned above and you should start to have more profitable outcomes. Trade wisely until we meet here again. |
Freelance financial markets writer and online publisher of the Trendzetterz.com S&P 500 Weekly Forecast service.
| Title: | Market consultant and writer |
| Company: | Trendzetterz |
| Address: | 81 Hickory Hollow Drive |
| Crossville, TN 38555 | |
| Phone # for sales: | 904-303-4814 |
| Website: | trendzetterz.com |
| E-mail address: | support@trendzetterz.com |
Traders' Resource Links | |
| Trendzetterz has not added any product or service information to TRADERS' RESOURCE. | |
Click here for more information about our publications!
PRINT THIS ARTICLE

Request Information From Our Sponsors
- StockCharts.com, Inc.
- Candle Patterns
- Candlestick Charting Explained
- Intermarket Technical Analysis
- John Murphy on Chart Analysis
- John Murphy's Chart Pattern Recognition
- John Murphy's Market Message
- MurphyExplainsMarketAnalysis-Intermarket Analysis
- MurphyExplainsMarketAnalysis-Visual Analysis
- StockCharts.com
- Technical Analysis of the Financial Markets
- The Visual Investor
- VectorVest, Inc.
- Executive Premier Workshop
- One-Day Options Course
- OptionsPro
- Retirement Income Workshop
- Sure-Fire Trading Systems (VectorVest, Inc.)
- Trading as a Business Workshop
- VectorVest 7 EOD
- VectorVest 7 RealTime/IntraDay
- VectorVest AutoTester
- VectorVest Educational Services
- VectorVest OnLine
- VectorVest Options Analyzer
- VectorVest ProGraphics v6.0
- VectorVest ProTrader 7
- VectorVest RealTime Derby Tool
- VectorVest Simulator
- VectorVest Variator
- VectorVest Watchdog